SUMMARY
This is AI generated summarization, which may have errors. For context, always refer to the full article.

MANILA, Philippines – On the same day President Rodrigo Duterte delivered his 2nd State of the Nation Address (SONA) on Monday, July 24, the Department of Tourism (DOT) reported its accomplishments in the first year of the Duterte administration.
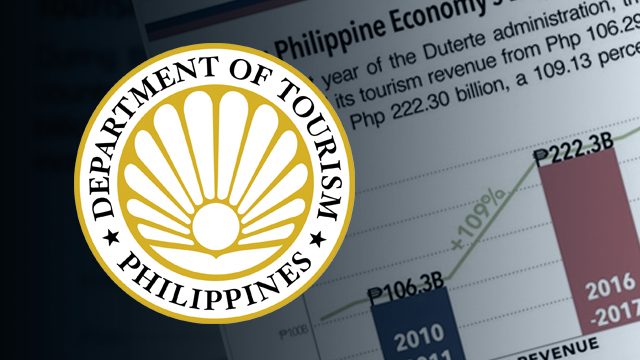
Using 2 graphs, the DOT said that tourist arrivals “increased by 71.83%” and tourism revenue “doubled” or increased by 109% during the first 11 months of Duterte’s term, compared to figures recorded in the first 11 months of the previous administration.
There was something amiss, however, in interpreting and presenting the numbers. Eagle-eyed netizens like @econcepcion on Twitter and Jayson Bernard Santos on Facebook pointed out that the graphs were “misleading.”
Even a Grade 4 kid can spot what’s wrong with the conclusion from these poorly made graphs. pic.twitter.com/uM66b0AcPp
— Ethel (@econcepcion) July 24, 2017
Percentage change, or the rate of change from an old value to a new one, is usually computed from the immediately preceding period of time.
Adding a line chart indicating percentage change directly from period 2010-11 to 2016-17 disregards progress achieved from Aquino’s first year to the end of his term (June 2016).
Compare apples to apples
If the DOT meant to emphasize the tourism achievements in the first year of the new administration, it should have compared improvements in tourist arrivals (or percentage changes) during President Duterte’s first year with that of his predecessor, Benigno Aquino III.
At the most, what Duterte administration can essentially take credit for at this point is the period from June 30, 2016 (the day he took his oath of office) until July 2017.
In fact, if you look at the statistics for the intervening years, you will see that the numbers for tourist arrivals and tourism receipts have been improving each year since 2011. (Available data for 2017 is only up until May. We noted on the graph that such is the case.)
The DOT should have displayed the figures for July 2015 to May 2016, the first 11 months of Aquino’s last year, and see how it compares with that for July 2016 to May 2017, the first 11 months of Duterte’s first year.
We then checked how many tourists visited the country in Aquino’s 1st 11 months (July 2010 to May 2011), and compared it with arrivals during the same period in the last year of his predecessor, Gloria Macapagal-Arroyo (or from July 2009 to May 2010).
Based on the chart above, tourist arrivals in Duterte’s first 11 months increased by 11.61% from the same period in Aquino’s last year.
Meanwhile, in Aquino’s first 11 months, tourist arrivals increased by 16.72% versus the numbers from Arroyo’s in the same period in her last year.
What data are readily available?
The statistics for 2017 so far, as displayed on DOT’s website under the “Industry Performance” page as of this posting, is until the month of May only. This may explain why only the first 11 months of the Duterte administration were considered for the graph. But there are no stats on the said page for tourism receipts.
Figures for tourist arrivals per year and per month, from 2009 onwards, are available on the DOT website.
However, for estimated tourism receipts, only full-year statistics are downloadable. The amounts, as used by the DOT in various reports, are sourced from “arrival/departure (A/D) cards, shipping manifests, and results of DOT’s Visitor Sample Survey.”
Rappler looked for readily available monthly breakdowns of estimated tourism receipts for a quick fact check, but only those for 2011 and 2013 are uploaded. It is part of DOT’s Travel and Tourism Statistics Booklet.
In the library at DOT’s head office in Makati City, only the 2015 statistics booklet is available, along with some tourist arrival and industry performance reports (generated in certain months) that contain data on estimated tourism receipts.
The full-year amounts for tourism receipts from 2010 to 2015 are featured on a DOT report in March 2016, The amount for 2016, meanwhile, was taken from an article by the Federation of Filipino Chinese Chamber of Commerce and Industry Inc, citing DOT statistics.
The Philippine Tourism Satellite Accounts (PTSA) of the Philippine Statistics Authority has full-year data on inbound tourism expenditures. Click the link to check for the formula used to compute its value.
– Michael Bueza/Rappler.com
Add a comment
How does this make you feel?
There are no comments yet. Add your comment to start the conversation.