SUMMARY
This is AI generated summarization, which may have errors. For context, always refer to the full article.
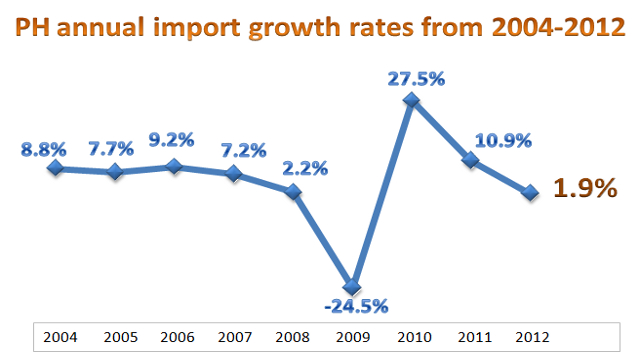
MANILA, Philippines (UPDATED) – The country’s merchandise imports hardly grew in 2012 as shipments of the main electronics group declined, the National Statistics Office (NSO) reported Tuesday, February 26.
NSO’s External Trade Performance report showed imports amounted to $61.66 billion in 2012, up by a measly 1.9% from $60.5 billion in 2011.
Electronics, which accounted for over 26% of total purchases, dropped 9.1% in 2012 to $16.20 billion from $17.83 billion the previous year.
Imports are raw materials used for the production of the country’s exports, a major driver of the economy. Exports grew 7.6% to $51.994 billion in 2012 from $48.304 billion in 2011, as electronics receipts fell 5.2% to $22.557 billion.
The import and export data resulted in a trade deficit of $1.26 billion for the Philippines, higher than 2011’s $1.23 billion.
December growth
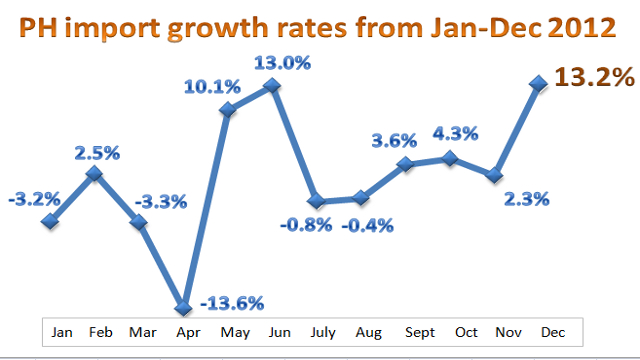
Import growth was way faster in December alone. Imports rose 13.2% during the month—the fastest in 16 months—to $5.25 billion from $4.63 billion in December 2011.
“The improvement in imports performance during the period represents a rebound in the value of imports from a 6.4% contraction a year ago and partly reflects the favourable sentiments of both businesses and consumers,” Socioeconomic Planning Secretary Arsenio M. Balisacan said in a statement on Tuesday.
The growth was mainly driven by carriers’ aircraft purchases as transport equipment shipments surged 192% to $698.23 million. These accounted for 13.31% of imports.
Electronics, which made up nearly 25% of the bill, however grew only 1.7% to $1.29 billion from $1.27 billion in December 2011.
Balisacan also noted that imports of consumer goods grew by 38.2% to US$688.3 million in December 2012 from $497.9 million from the same month in 2011. This was due to higher payments for both durable (50.4%) and non-durable (28.1%) consumer products.
Imports of raw materials and intermediate goods, meanwhile, also increased by 6.1% as values of both imported unprocessed raw materials (40.4%) and semi-processed raw materials (0.9%) registered annual gains.
“The higher receipts from imported consumer goods were due in part to the more favourable sentiments of consumers, specifically towards durable items,” Balisacan said.
“Higher importation of raw materials and intermediate goods was partly due to heightened optimism among importers that demand for goods would increase in the near-term because of additional projects, business expansion, and continued investor confidence,” he added.
Major markets
The US was the Philippines’ top source of imports in 2012, with a share of 11.54%. Some $7.12 billion imports were purchased from this country, up 8.9% from 2011.
China came in second, accounting for 10.81% of total receipts. Imports from this country rose 9.5% to $6.66 billion in 2012.
Japan followed with a share of 10.45% or $6.44 billion, then Taiwan (7.84% or $4.83 billion), Korea (7.3% or $4.5 billion), and Singapore (7.1% or $4.40 billion). – Rappler.com
Add a comment
How does this make you feel?
There are no comments yet. Add your comment to start the conversation.