SUMMARY
This is AI generated summarization, which may have errors. For context, always refer to the full article.
 I have to admit that for most of my stock market-investing friends, the recent market sell-off was like some unexpected “storm surge” enveloping the Makati CBD area. Totally unexpected in our “ber” months of merry-making, but still creating zombie-like yuppies sauntering in the malls and pubs.
Many were more shaken than stirred when my Twitter friend and mutual follower Jesse Colombo (twitter nick @TheBubbleBubble) came out with his Bloomberg piece calling it a Philippine “bubble” just when the index hit a major technical breakdown.
Given the number of Philippine “boom-bust” cycles we all have been through since the 1970s, calling a Philippine bubble was like cleverly predicting a Category 3 typhoon hitting us sometime next year.
For me, as a PSEi market practitioner since the 90s, I actually cherish it when people use that bubble word – or even just as an odd twitter username.
It actually tells me there is most likely no bubble simply because people are already expecting it, and prices already reflect that fear. Except perhaps for the Bangko Sentral ng Pilipinas, which will never feel the need to say that “b” word because they always assume they are doing an “A” job.
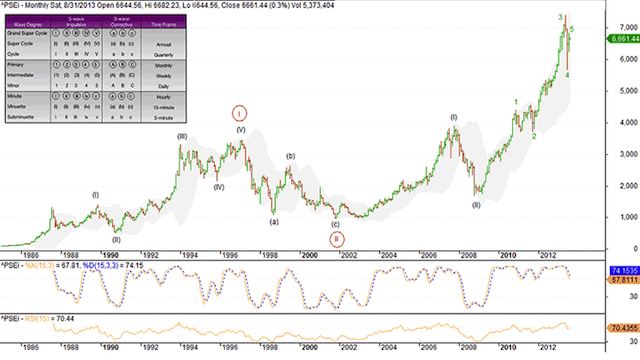
Going back to the PSEi, let me share with you why it’s probably not about the “b” at all, but more about an inverted “y.” Here is my chart of the PSEi since 1985.
My maid is actually on her way to National Bookstore to get me a red highlighter pen, for sure a relatively cheap one as the market doesn’t make me feel like spending, which is also perhaps reflective of most mall patrons judging from what I see. Okay, she’s almost here.
In Elliot Wave Theory (see below) we expect to get those 1-2-3-4-5 in up trending waves, just to be followed by a painful A-B-C down wave; that is, after the last up trending Wave 5 concludes itself.
But note that in Elliot, that Wave 5 doesn’t have to get way higher than Wave 3. In fact within the PSEi experience since 1985, it has been more of a consistent “double top” where the Wave 5 peak barely surpasses the height of Wave 3 ( i.e. 1997 vs. the 1994 top in particular)
Enough talk for now, let’s put my seasoned art skills to work. Here is that inverted y formation of the PSEi as beautifully hand painted by yours truly.
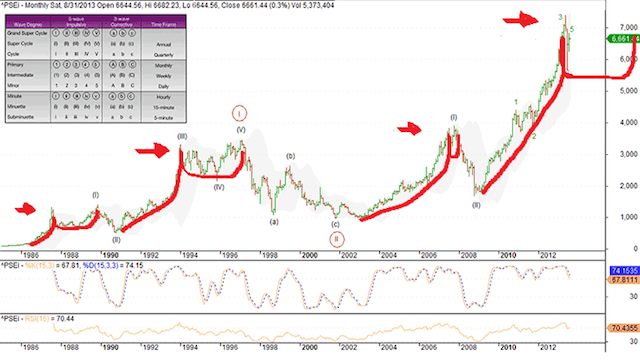
Not exactly a Picasso, but perhaps just a few more art lessons close. As you can see from the chart above. For the past 4 times, the legs of that inverted y have been a Wave 1 and Wave 3. Only to peak (see red arrows) at the height of Wave 3, after which a 20 to 25% correction typically follows.
Then the PSEi range trades up and down from then on, never getting close to the peak but going sideways until a retest – and a major A-B-C correction unfolds.
The A-B-C corrections are in blue circles below.
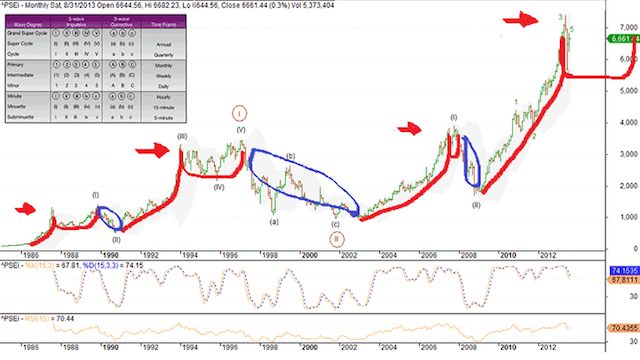
As we can see in 1987 to 1989 and in 1994 to 1997 ( i.e. the cleavage of the y) the PSEi undergoes a sideways, range trading mode for as much as two to three years. Ouch!
For example in 1994 to 1997, the PSEi range traded between 2,500 and 2,950 after peaking at 3,300. In other words, the range trading happened still way below the peak or that red arrow at 3,300 PSEi.
Today, isn’t the same thing happening? After peaking at 7,399, aren’t we just range trading between 5,500 and 6,500? It has been 6 months of sideways consolidation since we peaked in May 2013.
But for the consummate trader amongst us, it is not entirely bad. In fact, it may actually have its trading advantages.
You see, during those Wave 1 and Wave 3 uptrending waves, almost every stock is moving, especially the blue chips, banks and huge index stocks.
But once that sideways, range trading scenario unfolds, some big-cap stocks are stuck going sideways.
What happens actually is that a few lighter stocks do very well, especially those that capture the imagination of the market. This is because the funds are more focused, unlike during a Wave 3 when almost everyone is playing almost everything.
If another PSEi inverted y unfolds in the next year or two, after our intermediate peak at PSEi 7,399 (see that last red arrow), then stock picking is the game and not mirroring the index.
For instance, during a sideways 94-97 period, MEG which just did its IPO back then, still climbed from P4.40/share to above P26/share.
And the same was true for Petron, Piltel and even Negros Navigation, which was my IPO back then as its lead manager. NENACO went from P5.60 to P12 in 6 months, at a time when the market in general was just going sideways.
Hence, if this y pattern holds, I would be selling the big index stocks, which may just be going sideways, and I will be positioning and trading on the lighter stocks, which have a chance of being anointed or hot “concept stocks” in a sideways, range trading market.
Perhaps the more speculative, such as gaming or leading property stocks, would be on my hit list. – Rappler.com
The author is Managing Director for Corporate Finance of the Center for Global Best Practices (CGBP). He was connected with PNB Capital & Investment Corp. as President & CEO and with Punongbayan & Arraulo, where he set up the first P&A/Ernst & Young Corporate Finance practice in the Philippines in 2001. Tony is active on Twitter for stock market newbies: @Tony88981.
Add a comment
How does this make you feel?
There are no comments yet. Add your comment to start the conversation.