SUMMARY
This is AI generated summarization, which may have errors. For context, always refer to the full article.
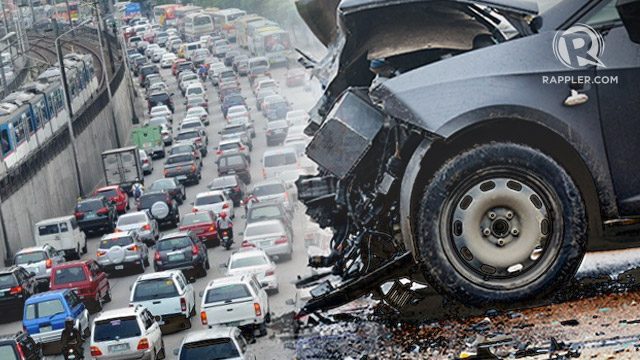
MANILA, Philippines – How can policy makers curb the high number of deaths on Philippine roads?
For starters, they should know how serious the problem is in the country so they can craft the necessary and appropriate countermeasures.
But the problem is that there is no comprehensive, nationwide database on road crash statistics in the Philippines.
For Rappler’s series of stories on road safety, we sought to gather data on the number of road crashes recorded nationwide, where these crashes usually occur, and how many people are either injured or killed in these incidents. (READ: IN NUMBERS: Road crash incidents in the Philippines)
But because of the lack of comprehensive data, we used figures from different government agencies, as there is currently no single agency with granular, disaggregated data providing details on road crashes.
Here’s what we observed from the data sources we used, and the limitations for each one.

Metro Manila Accident Recording and Analysis System (MMARAS)
For crashes in Metro Manila, Rappler used data from the 2010 to 2016 MMARAS reports released by the Metropolitan Manila Development Authority (MMDA).
There are two data sources for the MMDA’s road safety unit researchers: obtaining individual report forms for each traffic incident, gathered from the different stations and district offices of the traffic enforcement units; and recording road crashes at MMDA’s Metrobase through calls and CCTV footage.
Previously, the MMDA only recorded incidents involving fatal and non-fatal injuries. The MMDA began recording crashes with damage to property beginning 2005 up to present.
The MMARAS reports provide the following information:
- Number of road crashes resulting to fatal injuries, non-fatal injuries, and damage to property, categorized by month
- Number of people killed and injured in road crashes for the year
- Distribution of road crashes by cities and municipalities in Metro Manila
- Breakdown of number of drivers, passengers, and pedestrians killed and injured, by district
- Breakdown of road crashes resulting in fatal, non-fatal injuries and damage to property, by time of day
- Breakdown of vehicle types involved in crashes
- Breakdown of collision type (hit and run, multiple collision, etc)
- List of top cause of road crashes (human error, vehicle defect, etc)
While the MMARAS provides detailed information, there are limitations and deficiencies in its data.
For its breakdown on the types of vehicles involved in road crashes, thousands are unknown vehicles – 6,409 as of the 2016 MMARAS report. For its breakdown on the type of collision, a significant number is also listed as “no collision stated based on police blotter book” – 36,921 as of the latest report.
Similarly, in its breakdown of the top cause of road crashes, there is no given definition for human error, and the MMARAS listed “human error” separately from more specific classifications such as “human error (alcohol suspected)” and “human error (driver error),” among others.
A huge bulk is also labelled as “no accident factor” – 105,734 cases in the 2016 MMARAS report.
But MMDA road safety unit officer Richard Domingo told Rappler that 80% to 90% of the causes labeled as “No Accident Factor” is human error.
While the MMARAS also lists the top crash-prone roads in the metro – which could help policymakers formulate and implement the necessary interventions to make roads safer – it does not provide numbers on how many crashes were recorded in these areas, which vehicles were involved, and what type of collisions had occurred.
The MMDA is also aware of the limitations of its data gathering process, noting that with the “relatively large” number of traffic accident investigators involved, it was “inevitable that there will be some data that is missed from the database.”
But it added that there was no firm evidence that large numbers are being omitted “because copied data are based from the records on the log book of every traffic stations where traffic accidents (major or minor) have been logged.”
Philippine Statistics Authority (PSA)
For our stories on nationwide numbers on road safety, Rappler relied on data from the PSA, which has consistently tracked the number of deaths resulting from road crashes. Our stories tracked the number of deaths recorded by the PSA from 2006 to 2014, the latest available dataset.
Aside from the total numbers, the PSA data showed the distribution of deaths by age group, gender, and region. It also categorized the deaths by cause: car occupants, motorcycle riders, bicyclists, or pedestrians injured in collisions with different vehicle types, among others.
What’s missing in the data however is a more thorough breakdown on the type of vehicles involved in the crashes. A bulk of the number is identified only as “unspecified transport accidents.”
The PSA data however remains a key source of consolidated nationwide data on road crashes, since the Department of Public Works and Highways (DPWH)’s Traffic Accident Recording and Analysis System (TARAS) was discontinued in 2013.
The TARAS was established in 2004 to collect road crash data from reports by the Philippine National Police (PNP). It was intended to identify road safety black spots and implement the necessary countermeasures.
But the DPWH said the TARAS was no longer sustainable because of the logistical challenge of training and re-training PNP officers collecting the road crash data, as well as supplying traffic accident record forms to the 1,500 police stations nationwide.
The department also noted that confidence levels in the quality of data from TARAS are “very low,” and that it only covers national roads, not local roads.
“Since being introduced in 2004, there have been no improvement in data quality of TARAS nor the primary issue of limited coverage on national roads has been addressed and it is unlikely under the current process that the data will be of sufficient coverage or quality to generate reliable statistics at the regional level,” it added in a 2013 department order.
Land Transportation Franchising and Regulatory Board (LTFRB)
To get data on road crashes involving buses, we turned to the LTFRB, which regulates the issuance of franchises to bus operators and companies. The data we obtained spanned 2015 until February 2017. The LTFRB said the data was recorded through police reports, social media reports, and calls to the board’s hotline.
The data showed the names of bus operators with violations, the number of fatalities and injuries in the crash, the date of the crash, place of incident, and the action taken by the LTFRB.
But the data did not show whether the erring bus companies had committed multiple violations before, and whether or not the recorded violation was a first offense or succeeding offenses. The information on fatalities and injuries also did not provide specifics on the age or gender of the victims, nor their classification (if they are pedestrians, passengers, or drivers).
There was also not enough sufficient information or explanation on the follow-up actions taken after placing the violators under preventive suspensions.
Local government units of Quezon City, Manila, and Makati City
Based on the MMARAS, 3 local government units (LGUs) in Metro Manila consistently top the list of cities with the most number of road crashes: Quezon City, Manila, and Makati City.
To get more details on the crashes recorded in their jurisdictions, Rappler sought road crash data from the 3 LGUs’ public safety units and police stations recording road crash data.
The most recent data we obtained from them covered January to March 2017.
For data from Makati City, the data showed the type of vehicles involved in the crashes, the number of injuries and fatalities, and the location of the crashes.
Data from Manila City showed the nature of the road crash, date, and location.
Data from Quezon City’s Department of Public Order and Safety, meanwhile, recorded the number of crashes per location, the number of vehicles involved, and the number of injuries and fatalities.
From the datasets obtained, it is clear that there is no standardized practice on how to accurately record road crash information, and how disaggregated the recorded data should be. The quality of the datasets also differ from agency to agency, making it difficult to accurately do comparisons or cross-check the information.
Under the Philippine Road Safety Action Plan, developing and maintaining a road crash database system is under one of the key pillars for a safer road environment. – with Kimiko Sy / Rappler.com
Add a comment
How does this make you feel?
There are no comments yet. Add your comment to start the conversation.