SUMMARY
This is AI generated summarization, which may have errors. For context, always refer to the full article.
On March 15, 2020, the first day of the enhanced community quarantine (ECQ) in Metro Manila, there were only 140 confirmed cases of COVID-19 nationwide, with 12 deaths and two recoveries.
A year later, on March 15, 2021, total coronavirus cases have reached 626,893, with 12,837 deaths and 560,577 recoveries, according to the Department of Health (DOH).

Here are more charts showing how COVID-19 infections progressed in the country in the last 12 months.
Jump to: New cases per day | Status by location | Deaths | Compared to ASEAN | Testing results | Bed occupancy | Vaccinations vs other countries
So far, the spread of COVID-19 in the country peaked at around August 2020. The one-day record of 6,958 new cases was reported that month, on August 10. The running 7-day average of daily new cases (which evens out sudden spikes or dips in the data) also never went below 3,000 for 5 full weeks, or from early August to early September.
A brief spike in new cases took place later in September, after which the numbers started to drop in October.
But in 2021, new infections started to pick up again notably after the holiday season, then gained steam in recent weeks. The country’s 7-day average of new cases as of March 15, 2021 is the highest since August 26, 2020.
Contributing to this recent surge are the 5,404 new cases reported on March 15, the 4th highest single-day increase ever, and the highest in 7 months, or since August 14, 2020.
The pace quickened a bit recently, as it took 51 days to breach 600,000 cases, from 500,000.
This was faster than the 67 days it took for the country to hit 500,000 cases, from 400,000.
The fastest pace in reaching the next 100,000 cases was still in August 2020, when in 24 days, total cases jumped over 200,000, from 100,000.
The chart above shows the share of new cases in each major area in the country per day since March 2020. Most new cases have usually been reported from virus epicenter Metro Manila (green shade in the chart) and Luzon (in red shade).
Around June 2020, cases surged in the Visayas (blue shade), especially in Cebu City, briefly turning it into the country’s second virus epicenter. In the last quarter of 2020 and well into February 2021, there was a substantial number of cases in Mindanao (yellow shade), mostly in Davao City.
In early 2021, an uptick in cases took place again in Cebu City and surrounding areas after the holidays. Meanwhile, the detection and local transmission of the United Kingdom variant in Mountain Province put the Cordillera Administrative Region (CAR) on high alert.
In recent days, Metro Manila has been seeing new cases in the thousands again. The last time this happened was around September and October 2020.
Going by the 7-day average of new cases per region, Metro Manila (red solid line in the chart) is the top source of new cases. The averages are likewise high in nearby Calabarzon (orange solid line) and Central Luzon (green solid line).
The spikes in new cases in Central Visayas (blue dashed line) in mid-2020 and in the first quarter of 2021 are also shown in the chart, as well as the wave of new cases in Western Visayas (red dashed line) that peaked around September 2020, and in Davao Region (yellow dotted line) that peaked around January 2021.
To illustrate this spread further, below is a map showing new COVID-19 cases in every city and town for every 3 months since March 2020.
To quell the spread of COVID-19, national and local governments imposed varying degrees of lockdowns, based on the status of COVID-19 in their respective areas.
It went from the strictest ECQ like the one imposed in Metro Manila in 2020, to the least restrictive modified general community quarantine or MGCQ, which has been enforced in many areas around the country in recent months.
As of March 2021, only Metro Manila and 9 other areas are under a slightly more restrictive general community quarantine or GCQ. Metro Manila has been under GCQ for around 7 1/2 months.
In terms of deaths due to COVID-19, the Philippines’ case fatality rate (CFR) remains below the global rate, which stood at 2.2% as of March 15, according to data from the World Health Organization (WHO).
However, after staying below 2% for nearly 6 months, or since early August 2020, the country’s CFR breached 2% once more on January 25, 2021. It hit a high of 2.16% on February 20 before inching down again to 2.05% as of March 15.
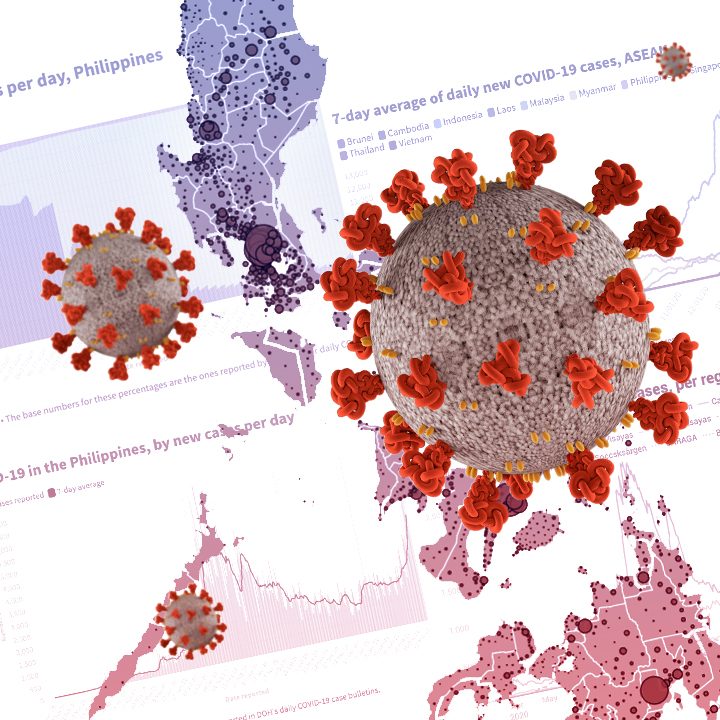
Compared to neighbors in Southeast Asia, the Philippines is one of two countries seeing an upward trend in a 7-day average of new cases as of March 2021. Cases are also up in Cambodia as of writing, but its average has stayed below 50 cases so far.
Months ago, around late September 2020, while the Philippines started to see a slowdown in the spread of the virus, the situation in Indonesia was the opposite: new cases there began to climb and continued to do so for many months. Indonesia’s total cases overtook the Philippines’ on October 15. Their 7-day average then reached almost 13,000 in February 2021 before it started going down to below 6,000 by mid-March.
Malaysia had a similar wave of new cases as Indonesia’s that started in October 2020, which has likewise gone down beginning February. Myanmar also weathered a surge around late 2020.
The current rise in new cases is also reflected in the country’s positivity rate, which measures how many among tested individuals turn up positive for the virus.
The daily positivity rate has been at above 10% in the last 6 days available in the DOH data, or from March 9 to 14. These double-digit rates in as many consecutive days last happened in late August 2020.
The two-week average positivity rate as of March 14 stands at 10.04%, which is also the highest since September 13, 2020.
The WHO recommends an average positivity rate of below 5% for 2 weeks before governments can consider reopening the economy. The Philippines’ two-week positivity rate had dipped below 5% in early to mid-December before it started going up again.
As for the progress in testing individuals for COVID-19, over 40,000 Filipinos have been tested daily in recent days, reaching the high levels the country had back in September. Testing suffered a slump during the holiday season, but soon recovered.
Hospitals and health facilities also felt the impact of COVID-19, as shown by the rate of occupancy of beds dedicated for COVID-19 patients.
So far, in March 2021, the occupancy rates for all types of beds, while still within safe levels, have been going up in all regions in Luzon, except for Ilocos Region and Bicol Region. The rate in Central Visayas also climbed in early 2021, but appeared to be slowing down by March.
Metro Manila nearly reached a critical level in late July 2020, prompting frontline workers to request for a two-week “timeout” to manage the rising number of cases in the metropolis. The government heeded the request, and placed Metro Manila under a more strict modified ECQ from August 4 to 18.
In CAR, the rate peaked in January 2021, around the time when cases in that region saw a fresh increase. In addition, multiple cases of the UK variant were confirmed in Mountain Province around that time as well.
After delays and logistical issues, the Philippines finally began its vaccination program on March 1. Frontline workers were the first group to receive the vaccine.
The country was the last in Southeast Asia to receive its initial set of vaccines, and among the last to start its vaccination program. Vietnam started its program on March 8, while Brunei aims to kick off the 1st phase of its program by the second quarter of 2021.
– Rappler.com
Vaccination map on this page comes from Our World in Data (OWID).
OWID is a data research website published by the Global Change Data Lab, an English charity based at the University of Oxford’s Martin Programme on Global Development. OWID collects data from official sources, such as national and subnational government and public health agencies.
Add a comment
How does this make you feel?
There are no comments yet. Add your comment to start the conversation.