SUMMARY
This is AI generated summarization, which may have errors. For context, always refer to the full article.

Data stories are not the usual stories people want to read.
Aside from the misconception that they’re sleepers, they usually require effort to catch the reader’s attention and keep them interested.
To make these stories easy to relate to, Rappler has been giving importance to creative strategies to make them interactive and easy to understand. A lot of time and effort are invested to produce the reader-friendly charts and fun visualizations.
The whole process includes doing thorough research about a topic or persistently requesting data from government agencies or think tanks. Researchers are lucky when the data needed is available online because it saves time.
As researchers who have experienced handling data requests and filtering excel sheets, our struggle in pursuing these kinds of stories starts as early as when we first try to get our hands on the data.
For Rappler’s road safety campaign, for instance, sending data letter requests requires daily follow-ups with the local police station to make sure such requests are not forgotten. However, the process varies per LGU, with an efficient LGU really making the task less burdensome.
There would be instances when a request would even be passed from one department to another until the office responsible for the data being sought is finally found.
The format of the data we get our hands on is another challenge on its own. It’s a good sign when we see it a spreadsheet or in an open format that’s easily read by a computer. It’s an early indication of the agency having a good data management system. But there are instances when we get data in pdf or even scanned formats that require us to retype and encode everything ourselves!
Processing is the bulk of the work. It’s a pain, really. For starters, “processing” involves keeping your database “clean”. This essentially means making sure format and terms being used are consistent. This might sound like an easy thing to do but it takes time. A clean database aids researchers like us in understanding how variables relate to each other and how the data can be presented.
After “cleaning” the data, the challenge to make it relevant to the readers is next.
Our data stories do not simply aim to present the numbers. We hope to go beyond that and ask what the numbers mean for ordinary Filipinos.
For the stories on road traffic crashes for instance, we try to move beyond the basic “who, what, where, when, why, and how,” and analyze trends and patterns in the crashes. We dig deeper and further question possible causes as they could point to solutions to the problem as well.
This can be seen in our data story in the province of Cagayan where we created a graph on the most common time crashes occur and the age group that is most at risk. We also plotted all the location of Tuguegarao’s crash incidents on a map. (READ: Deadly highways: What makes Cagayan Valley roads crash-prone? )
In another story, where an Angkas passenger figured in a crash, besides reporting on what happened, we also looked into the liability issues surrounding the complex case of the incident. (READ: Angkas passenger in coma after crash: Who’s liable? )
Worth it
What makes the whole process worthwhile is seeing the impact of all these efforts.
During the first leg of our Road Safety Forum, for example, we invited leaders, stakeholders, and advocates to discuss the different factors that affect road safety conditions in Metro Manila.
Quezon City Vice Mayor Joy Belmonte who attended the event said that she was shocked to see the alarming number of crash incidents in the city and decided to take action by spearheading the creation of the Quezon City Road Safety Code.
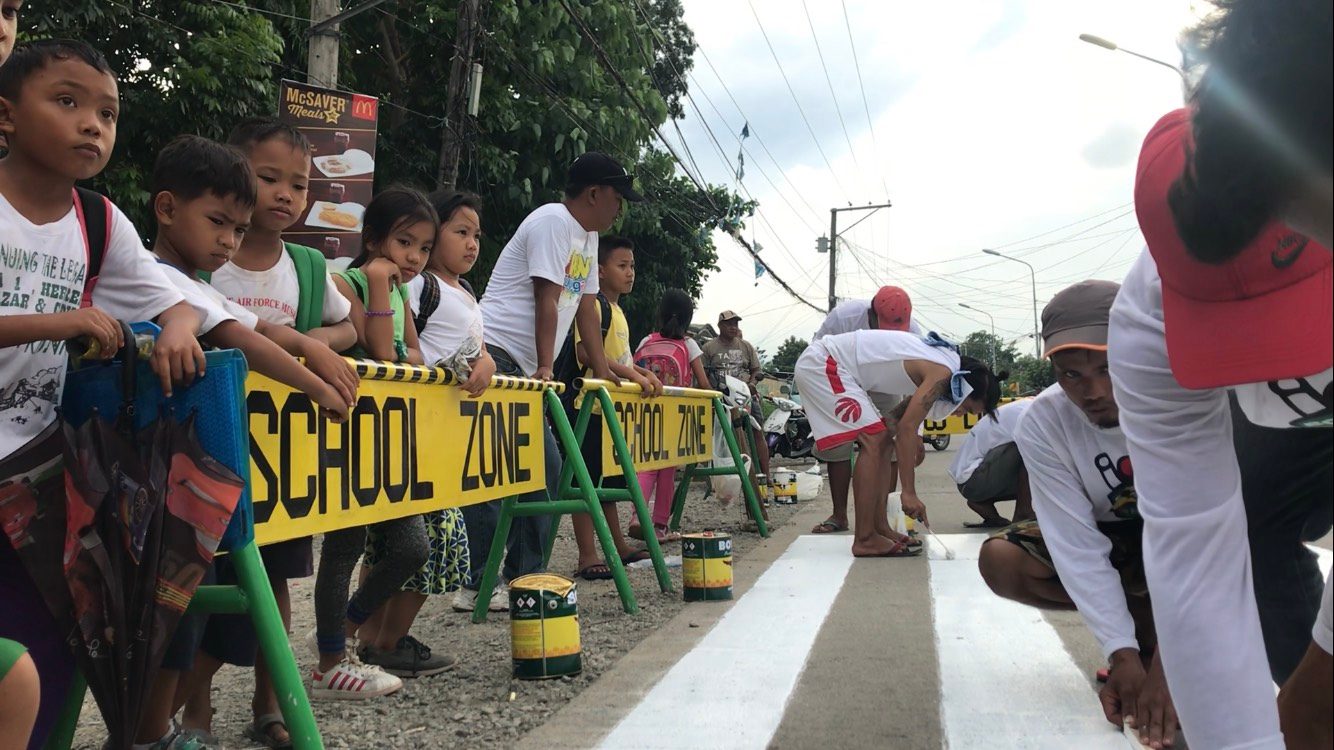
Another milestone from the campaign was the result of our road safety forum in Tuguegarao City.
After we presented our analysis during the road safety forum in Tuguegarao, the local police discovered the need for pedestrian lanes. Concerned citizens who learned about the lack of such lanes decided to volunteer and donate to have pedestrian lanes painted in a number of school zones.
These are just some of the reasons why we spend hours scouring and cleaning over thousands of rows of data when we know that readers would prefer to read about their favorite celebrities.
We do this because huge databases sometimes, if not always, hide anomalies. Sometimes a mismatch in the way government funds are disbursed can be spotted. Research can also show how trillions of pesos have been lost to corruption instead of being used to improve social services.
Huge databases can also uncover truths that remain untold because they give the government a bad name. Like finding out that three-fourths of the Philippine road network is unpaved or that many barangays around the country have little or no access to national roads which in turn, prevents economic development. This prompts people to ask, “Where are my taxes going?”
It’s not an easy task but the public needs to know. By digging through databases and writing data stories, we constantly remind the government that we are watching. – Rappler.com
Add a comment
How does this make you feel?
There are no comments yet. Add your comment to start the conversation.