SUMMARY
This is AI generated summarization, which may have errors. For context, always refer to the full article.
 at Tacloban, eastern island of Leyte on November 9, 2013. AFP/Noel Celis")
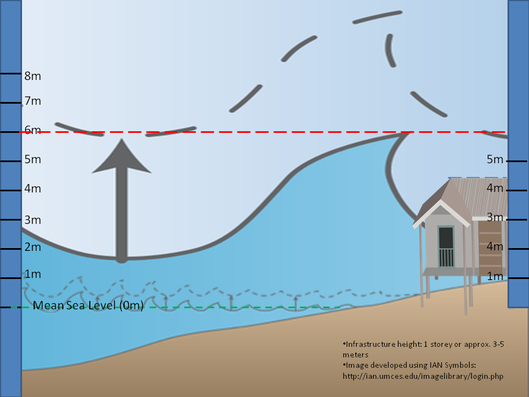
A storm surge happens when the sea level rises beyond the normal tide levels, due to strong winds and low pressure from typhoons.
Strong waves and high water levels from storm surges can inundate coastal areas and damage properties. It is a dangerous natural force that could severely impact properties and lives: so, it is important to determine where it will happen.
Video produced by the US National Oceanic and Atmospheric Administration (NOAA) National Hurricane Center demonstrates the power of storm surges. (Click here for the animations A, B, and C.)
The recent storm surge and its devastating impacts on the Philippines’ Visayas region have exposed the country’s vulnerability to severe storm surge; and because there is no local terminology for storm surges, many people did not fully understood what was coming. If areas potentially flooded by the storm surge have been mapped before it actually occurs, people could have been more prepared.
Mapping storm surges before it happens
It is possible to map storm surges before they happen. In cases of storm surges from typhoons, the typhoon strength and direction can be predicted so thus the wind speed, pressure and wind direction. We also need to know the tide level before, during and after the typhoon: these also can be predicted. Then we need to know which provinces, municipalities and barangays are on the typhoon path.
With these, we can estimate how many people might be affected and evaluate how many properties are at risk. We also need to know the intensity of flooding from upper catchment because this can add to the storm surge water level. Finally, we need to know the topography of the land as communities living on low and flat terrain near the coasts are more vulnerable.
We can combine all these information in a geographic information system to create a storm surge map with the storm surge depth overlain on administrative maps [1]. This map can guide national disaster agencies in identifying priority areas of intervention.
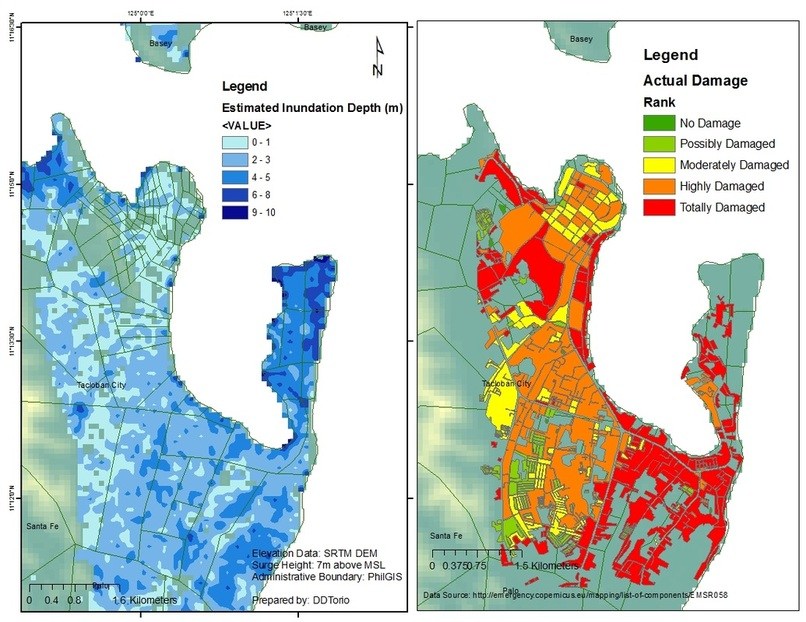
The image on the left is an example of a crude map of the storm surge depth from typhoon Yolanda that hit Tacloban. I created this map using publicly available data. The storm surge is assumed to have a height of about 6 meter above highest high tide at that time which is around 0.83 meter: this equals to about 7 meter total water height above mean sea level [2, 3]. I calculated the surge depth from SRTM digital elevation model (DEM)[4]. The dark blue colors represents the deep waters and the light blue are shallow depths Then I overlay the provincial, city and barangay boundaries [5].
I did not account for catchment flooding and precise typhoon direction because these data are not readily available, however, these can be easily included in the analysis. All the analyses took less than 30 minutes assuming all data and software are available. The image on the right shows the actual damage from recent assessments conducted by the European Union Copernicus Emergency Management Service [6]. We can see a high degree of correspondence between flooded areas and the intensity of the damage.
Lack of local storm surge term
At present, there is no Filipino term for storm surge. Since storm surge is a combination of wave and flooding I thought of naming it as ‘delubyong daluyon o delubyong alon,’ which comes from ‘delubyo’ or deluge which literally means destructive flood, and ‘daluyon’ or ‘alon’ which means waves. When we combine the two terms they literally mean destructive flood waves.
With or without disaster, information is critical
The only way to generate reliable information is by using reliable data. In this sense, the government should start investing on high quality data for short term and long-term planning purposes. Examples of such data includes: high spatial and vertical resolution topographic data of the coasts from light detection and ranging (LiDAR) systems [7], high spatial resolution optical remote sensing data, data on oceanographic and coastal processes, process models, population growth rates, land use change rates, property valuations and the current state of critical infrastructures specially evacuation centers.
Meanwhile, policy makers and implementers must scrutinize and revise if necessary the existing Philippine coastal land use policies. Being a country with the fourth longest coastline [8,9] and on the top three most vulnerable to climate change [10]: it might be the right time for the Philippines to consider establishing an institute dedicated to study coastal processes. Both short and long term planning and response could benefit greatly if the right information is available at the most critical time and the right infrastructure and mindset are in place. And for all citizens, we should take warnings seriously and act accordingly.
 Dante Torio is a PhD student in geography at McGill University in Montreal, Canada, specializing in spatial ecology of coastal areas. He studies the application of spatial techniques and systems modeling principles in understanding people and environment interactions along the coasts.
References
[1] http://www.jcronline.org/doi/abs/10.2112/JCOASTRES-D-12-00162.1
[2]http://tides.mobilegeographics.com/calendar/month/6302.html
[3] http://www.huffingtonpost.com/2013/11/07/super-typhoon-haiyan-philippines_n_4235250.html
[4] http://srtm.csi.cgiar.org/
[5] http://philgis.org/
[6]“Copernicus Emergency Management Service – Mapping.” Institute for the Protection and Security of the Citizen (IPSC), European Commission, Joint Research Centre (JRC). Accessed November 22, 2013. http://emergency.copernicus.eu/; http://emergency.copernicus.eu/mapping/list-of-components/EMSR058
[7]http://www.sciencedirect.com/science/article/pii/S0964569111001463
[8]https://www.cia.gov/library/publications/the-world-factbook/geos/rp.html
[9]http://en.wikipedia.org/wiki/List_of_countries_by_length_of_coastline
[10]http://www.ehs.unu.edu/file/get/10488.pdf
Images and Symbols: Symbols for diagrams courtesy of the Integration and Application Network (ian.umces.edu/symbols).
Storm surge animations: http://www.nhc.noaa.gov/surge/
Add a comment
How does this make you feel?
There are no comments yet. Add your comment to start the conversation.