SUMMARY
This is AI generated summarization, which may have errors. For context, always refer to the full article.
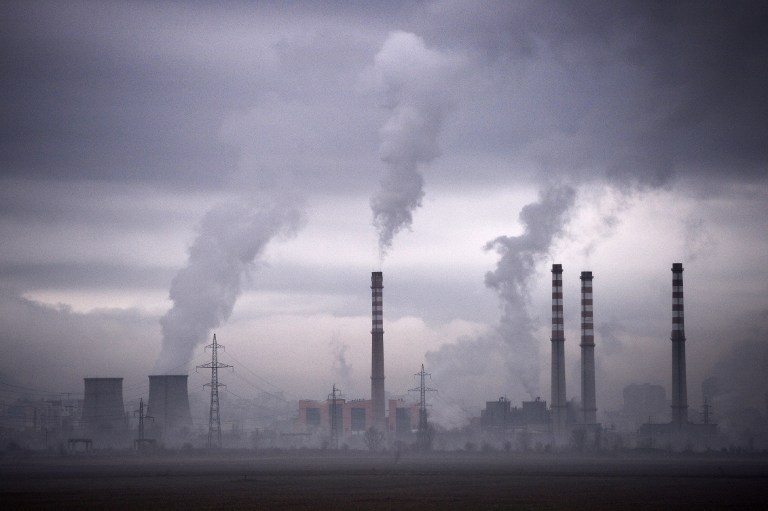
STOCKHOLM, Sweden – These are highlights from a report issued by the UN’s Intergovernmental Panel on Climate Change (IPCC) on Friday.
READ: Warmer Earth, humans to blame – UN panel
General
“Warming of the climate system is unequivocal, and since the 1950s, many of the observed changes are unprecedented over decades to millennia. The atmosphere and ocean have warmed, the amounts of snow and ice have diminished, sea level has risen and the concentrations of greenhouse gases have increased…. Human influence on the climate system is clear.”
“Limiting climate change will require substantial and sustained reductions of greenhouse gas emissions.”
The situation today
“It is extremely likely that human influence has been the dominant cause of the observed warming since the mid-20th century.”
“(…) Each of the last three decades has been successively warmer at the Earth’s surface than any preceding decade since 1850. In the northern hemisphere, 1983-2012 was likely the warmest period of the last 1,400 years.”
Warming since 1951 has been about 0.12ºC per decade. This slowed over the past 15 years to 0.05ºC per decade, but the timescale is too short to read anything into that yet, says the report.
Extreme events
“Changes in many extreme weather and climate events have been observed since about 1950.” The number of cold days and nights has decreased, and number of warm days and nights has increased. “It is likely that the frequency of heatwaves has increased in large parts of Europe, Asia and Australia,” says the report. “The frequency or intensity of heavy precipitation events has likely increased in North America and Europe.”
Ocean warming
The ocean stored more than 90 percent of the energy accumulated between 1971 and 2010. “It is virtually certain that the upper ocean (0-700 m) warmed from 1971 to 2010 and it likely warmed between the 1870s and 1971.”
Ice
“Over the last two decades, the Greenland and Antarctic ice sheets have been losing mass, glaciers have continued to shrink almost worldwide, and Arctic sea ice and northern hemisphere spring snow cover have continued to decrease in extent.”
Loss of Greenland’s icesheet has likely increased from 34 billion tonnes per year in the decade to 2001 to 215 billion tonnes a year over the following decade. In Antarctica, the rate of loss likely increased from 30 billion tonnes a year to 147 billion tonnes a year over the same timescale, mainly from the northern Antarctic peninsula and the Amundsen Sea sector of West Antarctica.
Arctic sea ice contracted at a rate as high as 4.1 percent a decade from 1979 to 2012; there has been shrinkage of summer ice extent every season and in every successive decade. But Antarctic sea ice “very likely” increased by up to 1.8 percent per decade during the same period.
Snow cover has been retreating in the northern hemisphere since the mid-20th century. There has also been a “considerable reduction” in the thickness and extent of Siberian permafrost over the last three decades.
Sea level
The global mean sea level rose by 19 cm from 1901-2010, an average 1.7 mm per year. This accelerated to 3.2 mm per year between 1993 and 2010. During the last period between Ice Ages, when temperatures were lower than those mostly projected for 2100, the maximum sea level was at least five metres higher than present, due to meltwater from Greenland but also from Antarctica.
Glacier loss and ocean thermal expansion account for about 75 percent of observed sea level rise since the early 1970s.
Greenhouse-gas levels
“The atmospheric concentrations of carbon dioxide (CO2), methane and nitrous oxide have increased to levels unprecedented in at least the last 800,000 years. CO2 concentrations have increased by 40 percent since pre-industrial times, primarily from fossil-fuel emissions and secondly from net land-use change emissions.”
In 2011, levels of CO2 , the main greenhouse gas, stood at 391 parts per million in the atmosphere, a rise of about 40 percent over pre-industrial levels. Up to 2011, total man-made emissions of CO2 since industrialisation were 545 billion tonnes of carbon. CO2 from fossil fuels and cements amounted to 365 billion tonnes of carbon. Deforestation and other land use accounted for 180 billion tonnes. The ocean has absorbed 155 billion tonnes; natural terrestrial systems 150 billion; 240 billion are in the atmosphere.
CO2 uptake by the sea very likely results in acidification of the ocean.
The Future (to 2100)
In its projections for the future, the report uses four scenarios called Representative Concentration Pathways (RCP). These are based on the amount of heat-trapping carbon gas that enters the atmosphere. They comprise RCP2.6, the lowest; RCP4.5; RCP6.0; and RCP8.5, the highest.
Warming
“Global surface temperature change for the end of the 21st century is likely to exceed 1.5ºC” compared to 1850, for all scenarios except RCP2.6. “It is likely to exceed 2ºC for RCP6.0 and RCP8.5 and more likely than not to exceed 2ºC for RCP4.5.”
The report sees these average rises in global surface temperature for the mid-term and the long-term, as compared to the start of the century:
(Note: The timelines are based on the average temperature measured over two decades, in order to gain a wider view. Their benchmark is also a two-decade span, the average temperature ranging from 1986-2005.)
To gain the overall view of warming since the Industrial Revolution, about 0.7ºC must be added (from 1850 to 2012, there has been warming of about 0.78ºC).
2ºC?
To have a good chance of meeting the UN target of limiting man-made warming to less than 2ºC compared to pre-industrial times, all carbon emissions from man-made sources must be limited to about 1,000 billion tonnes, or gigatonnes. “An amount of 531 gigatonnes was already emitted by 2011,” warns the report.
| Scenarios | 2046-2065 | 2081-2100 |
| RCP2.6 | 1.0ºC (in a range of 0.4 – 1.6ºC) | 1.0ºC (in a range of 0.3 – 1.7ºC) |
| RCP4.5 | 1.4ºC (0.9 – 2.0ºC) | 1.8ºC (1.1 – 2.6ºC) |
| RCP6.0 | 1.3ºC (0.8 – 1.8ºC) | 2.2ºC (1.4 – 3.1ºC) |
| RCP8.5 | 2.0ºC (1.4 – 2.6ºC) | 3.7ºC (2.6 – 4.8ºC) |
Sea-level rise
The report sees the following average rise in global sea level (in meters):
| Scenarios | 2046-2065 | 2081-2100 |
| RCP2.6 | 0.24 m (range of 0.17 – 0.32 m) | 0.40 m (range of 0.26-0.55 m) |
| RCP4.5 | 0.26 m (0.19 – 0.33 m) | 0.47 m (0.32 – 0.62 m) |
| RCP6.0 | 0.25 m (0.18 – 0.32 m) | 0.48 m (0.33 – 0.62 m) |
| RCP8.5 | 0.30 m (0.22 – 0.38 m) | 0.63 m (0.45 – 0.82 m) |
Extreme weather events
Exceptional rainstorms are “very likely” to become more intense and more frequent over mid-latitude countries and the wet tropics. The area encompassed by the monsoon systems is likely to increase over the 21st century, and monsoon rainfall is likely to intensify. The monsoon season is likely to lengthen in many regions.
Ice cover
By 2100, year-round reductions in the extent of Arctic sea ice are seen under all scenarios. They range from a shrinkage in summer sea ice of 43 percent under RCP2.6 to 94 percent under RCP8.5, to eight percent of winter ice under RCP2.6 to 34 percent under RCP8.5.
Beyond 2100
“Most aspects of climate change will persist for many centuries even if emissions of CO2 are stopped. This represents a substantial multi-century commitment created by past, present and future emissions of CO2.”
“Depending on the scenario, about 15 to 40 percent of emitted CO2 will remain in the atmosphere longer than 1.000 years.”
Sea levels will rise for “many centuries” beyond 2100 due to thermal expansion. If CO2 stabilises below 500 parts per million (ppm), the rise is likely to be less than 1 m by 2300; but it will be up to 3 m if CO2 concentrations are beyond 700 ppm.
The rise would be higher in the event of “sustained mass loss” by ice sheets. The near-complete loss of the Greenland ice sheet over a millennium or more would drive up the seas by up to 7 m. Rough estimates say the threshold for this is between 1ºC and 4ºC over pre-industrial levels. – Rappler.com
Add a comment
How does this make you feel?
There are no comments yet. Add your comment to start the conversation.