SUMMARY
This is AI generated summarization, which may have errors. For context, always refer to the full article.
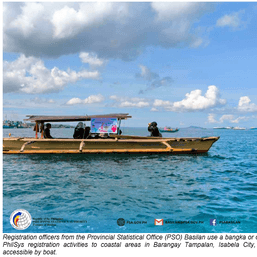
![[ANALYSIS] How well are we measuring PH poverty?](https://www.rappler.com/tachyon/r3-assets/612F469A6EA84F6BAE882D2B94A4B421/img/7E3C1FF9D0424970A1118861551463BC/measureph-poverty.jpg)

It’s high time we updated how we measure poverty in the Philippines.
Last week the Philippine Statistics Authority (PSA) published the latest poverty data. According to them, for the first half of 2018, 21% or one in 5 Filipinos can be considered “poor.”
This certainly looks like an improvement from 2015, when poverty clocked in at 27.6% or roughly one in 4 Filipinos.
But this result was met with a mixture of doubt and disbelief.
First, many could not reconcile this reduction in poverty with the palpable rise of economic hardship, particularly due to the abnormally high prices of goods and services.
Second, the PSA also announced that a family of 5 needs at least P10,481 a month (or P2,096 a month per family member) to meet basic needs. For many this budget seems ridiculously low.
By and large, PSA’s data is credible. But this is perhaps as good a time as any to highlight the problems we face in measuring the true extent and depth of poverty in the Philippines.
Overview
To produce poverty data, government first sets a reasonable “poverty threshold” or income level below which a person or family is considered poor.
For the first 6 months of 2018 the poverty threshold was set at P12,577 per person. Dividing this by 6 months, this means a typical Filipino needed at least P2,096 a month to pay for one’s basic food and non-food requirements.
For food requirements, the United Nations recommends at least 2,100 kilocalories (kcal) per person per day. The Food and Nutrition Research Institute (FNRI) then comes up with a food menu which meets this energy requirement.
Table 1 shows the cheapest meals that will give a Filipino at least 2,000 kcal per day. (For some reason the FNRI’s benchmark is 100 kcal short of the UN recommendation). The latest poverty data used the food menu developed back in 2012.
Table 1.
The prices of all these food items were collected by the PSA, and the resulting value of the food menu amounted to the food threshold.
As for non-food requirements, the government simply assumes that food takes up 70% of one’s budget, and non-food items take up the remaining 30% (for house rent, education, health, etc.).
Given the above, how can we improve the current methodology?
1) We need more realistic food menus.
For starters, we might need to have more realistic food menus.
For instance, the current energy requirement of 2,000 kcal may need to be reviewed. In India and Kenya, for example, it’s 2,250 kcal per person per day.
Some studies also suggest that different energy requirements can be applied to different households, instead of using a fixed 2,000 kcal for all households.
In other countries, the energy requirement among rural households is larger than among urban households (for whom life is less active and more sedentary).
2) We need to take better account of households’ different sizes and ages.
Poverty thresholds must also vary across households of different demographics.
For instance, we know that children typically need less food than adults. The housing and electricity bills of a 5-person household are also not 5 times that of a one-person household.
We can get around this by converting the number of warm bodies in a household into the number of adults they effectively represent. This is done using so-called “equivalence scales.”
Oddly, Philippine poverty statistics to this day do not use equivalence scales. This may distort our general picture of poverty, especially when comparing poverty among different groups in the population.
3) We need to take better account of non-food items.
For the longest time our poverty statistics have been assuming that food items constitute about 70% of a family’s budget, and the residual 30% goes to non-food.
But perhaps it’s time we reviewed this assumption. Although simple, it is by no means the only one available. Other countries use different methods. For instance, in Viet Nam they use instead the non-food spending patterns of the middle 20% of families ranked by income. In South Korea they use the cost of the minimum apartment size and the non-food spending of the poorest 40% of households.
4) We need to make poverty data comparable over time.
To get a real sense of how much poverty is changing, government must always ensure that poverty data is comparable over long stretches of time.
Although the latest 2018 data was comparable with 2015 data, we don’t yet have the updated figures before 2015. The reason is that government recently switched to using 2012 prices instead of 2006 prices as the reference for their computations.
The result is that there were previously 26.6 million poor Filipinos in 2015, even as latest data says there were 27.9 million poor Filipinos instead in 2015. To the uninitiated, this might look like poverty was way worse before.
Perhaps we need to recompute new poverty data using the old 2006 base year, or better yet, recompute past poverty data using the new 2012 base year.
5) We need to recognize that poverty has multiple dimensions.
Lastly, our current poverty statistics put a lot of emphasis on nutrition and income, despite the fact that poverty is now widely recognized as being “multidimensional.”
Even if you have sufficient food or pay, you might still be considered poor if you don’t obtain a minimum level of basic education or a sufficient number of healthcare services.
In 2014, I became involved in research on the so-called “multidimensional poverty index” (MPI). The PSA has since incorporated this in their statistics. They found that 10.4% and 7.1% of Filipinos were “multidimensionally poor” (or deprived in at least a third of the 13 identified indicators) in 2016 and 2017, respectively.
Apparently, Filipino households were most deprived in terms of education: about half of households in 2017 had at least one adult member who did not complete basic education.
It’s a good thing that the PSA is seriously looking into this. The beauty of the MPI is that it significantly broadens our notion of poverty and allows us to target programs and interventions more effectively.
Room for improvement
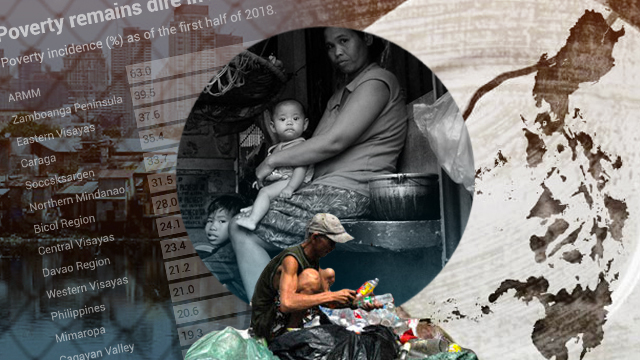
It’s quite sobering to know that one in 5 Filipinos still cannot afford more than P2,096 in a month.
Figure 1 also shows that poverty is so much direr in the regions. In ARMM, for instance, a whopping 2 out of 3 Filipinos remain poor.
Figure 1.
But let’s bear in mind that our picture of Philippine poverty is far from completely satisfactory, and perhaps it’s time we revamped our methodologies.
We need to get our poverty numbers as straight as possible, especially with the many threats the poor are currently facing on all fronts – even from government itself. – Rappler.com
The author is a PhD candidate at the UP School of Economics. His views are independent of the views of his affiliations. Follow JC on Twitter (@jcpunongbayan) and Usapang Econ (usapangecon.com).
Add a comment
How does this make you feel?
There are no comments yet. Add your comment to start the conversation.