SUMMARY
This is AI generated summarization, which may have errors. For context, always refer to the full article.
![[ANALYSIS] Coronavirus cases in PH could reach 26,000 by end-March if random spread not contained](https://www.rappler.com/tachyon/r3-assets/612F469A6EA84F6BAE882D2B94A4B421/img/D83DB207E4274A86BCDCA950A9FF3F08/coronavirus-cases-in-ph-could-reach-26000-by-end-march-if-random-spread-not-contained-march-17-2020.jpg)


What’s this about?
Indeed, this is a new kind of war we are fighting. “New” to our generation, at least – the COVID-19 virus.
Isn’t it crazy how in late December and early January we were just watching and following the news on how the virus has gripped China? It wasn’t until January 30, 2020 when we had the first confirmed case in the Philippines. Until the 5th of March, we only had 5 confirmed cases.[1] We were fine.
Then things developed really fast from there; now we are at 140 confirmed cases. Now the entire island of Luzon is on an enhanced community quarantine.
In this article, we share some of the results from an elementary mathematical model that allows us to project the potential growth of confirmed cases.
Findings
Data from western countries conclusively indicate that the increase in COVID-19 cases follows a sustained exponential growth in the first two weeks when significant cases (>10) are reported. This is expected since the virus will only show symptoms 97.5% of the time after 11.5 days[2]; hence, cases get reported only after about two weeks since its existence.
The current 142 cases in the Philippines, with 29 reported on Monday, March 16, follows closely this exponential trend shared by western countries (e.g., Italy, Germany, USA, etc). And we expect that every two days, the reported new cases will double.
To illustrate, we are projecting about 58 new cases on March 18 and 116 cases on March 20. If this trend continues, the total cumulative infected patients will be 1,611 by March 23. And if the dynamics does not change/improve, it can reach up to 18,300 the week after that (March 30).
Finally, by the end of the month (March 31), we might be grappling with 25,894 cases. If we do not have enough kits to test this much number of individuals, then expect that the number of confirmed cases to be reported to be lower than this.
Why should we be worried?
Many reasons but most importantly, we’re worried because this number is not something we believe our healthcare system can handle. In Metro Manila, 800 people struggled for one hospital bed or a 1:800 ratio; and we were short by 42,000 hospital beds.[3] This number may have already improved since 2017, but we are still worried about the nationwide distribution and accessibility of these facilities.
Where can we put another 26,000 potentially infected patients who are highly contagious?
The data has spoken, and we can only hope it’s lying
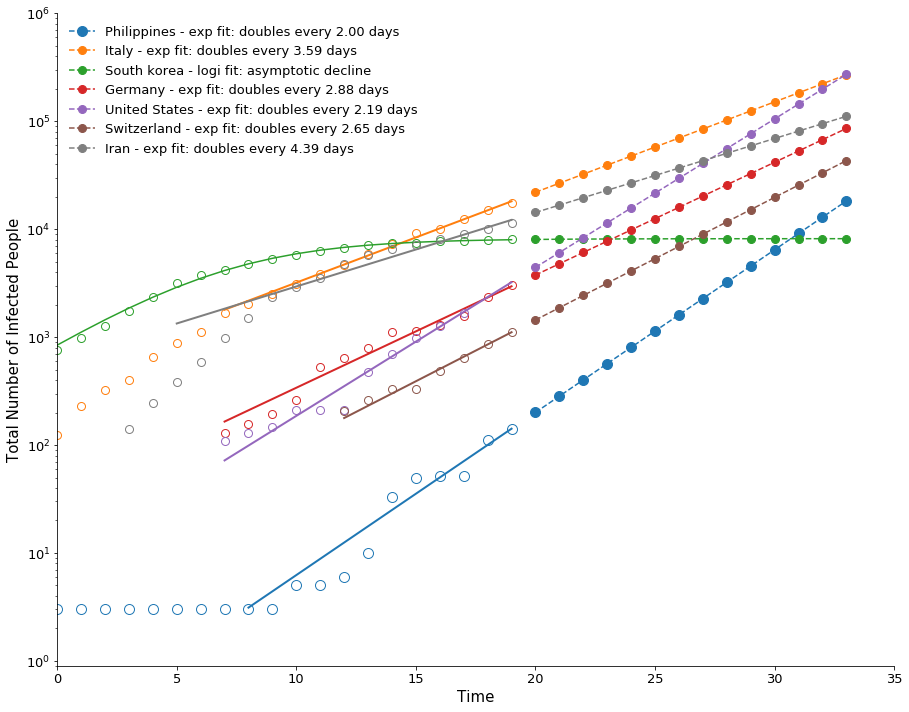
Empirical data show that we have a convincing exponential growth of the infected population. This is seen in the figure below plotted in a semi-log scale.
To compare across country trends, we set all of Monday’s (March 16, 2020) data points to Day 20, and make projections until March 30, 2020.
How confident and accurate are we?
We are not the ones talking here; it is the math and the data. For reproducibility, we have made our code open to all interested. You can download it here if you want to play around with the above fit and the data reported: https://github.com/eflegara/COVID19PH-Projection.
Projection
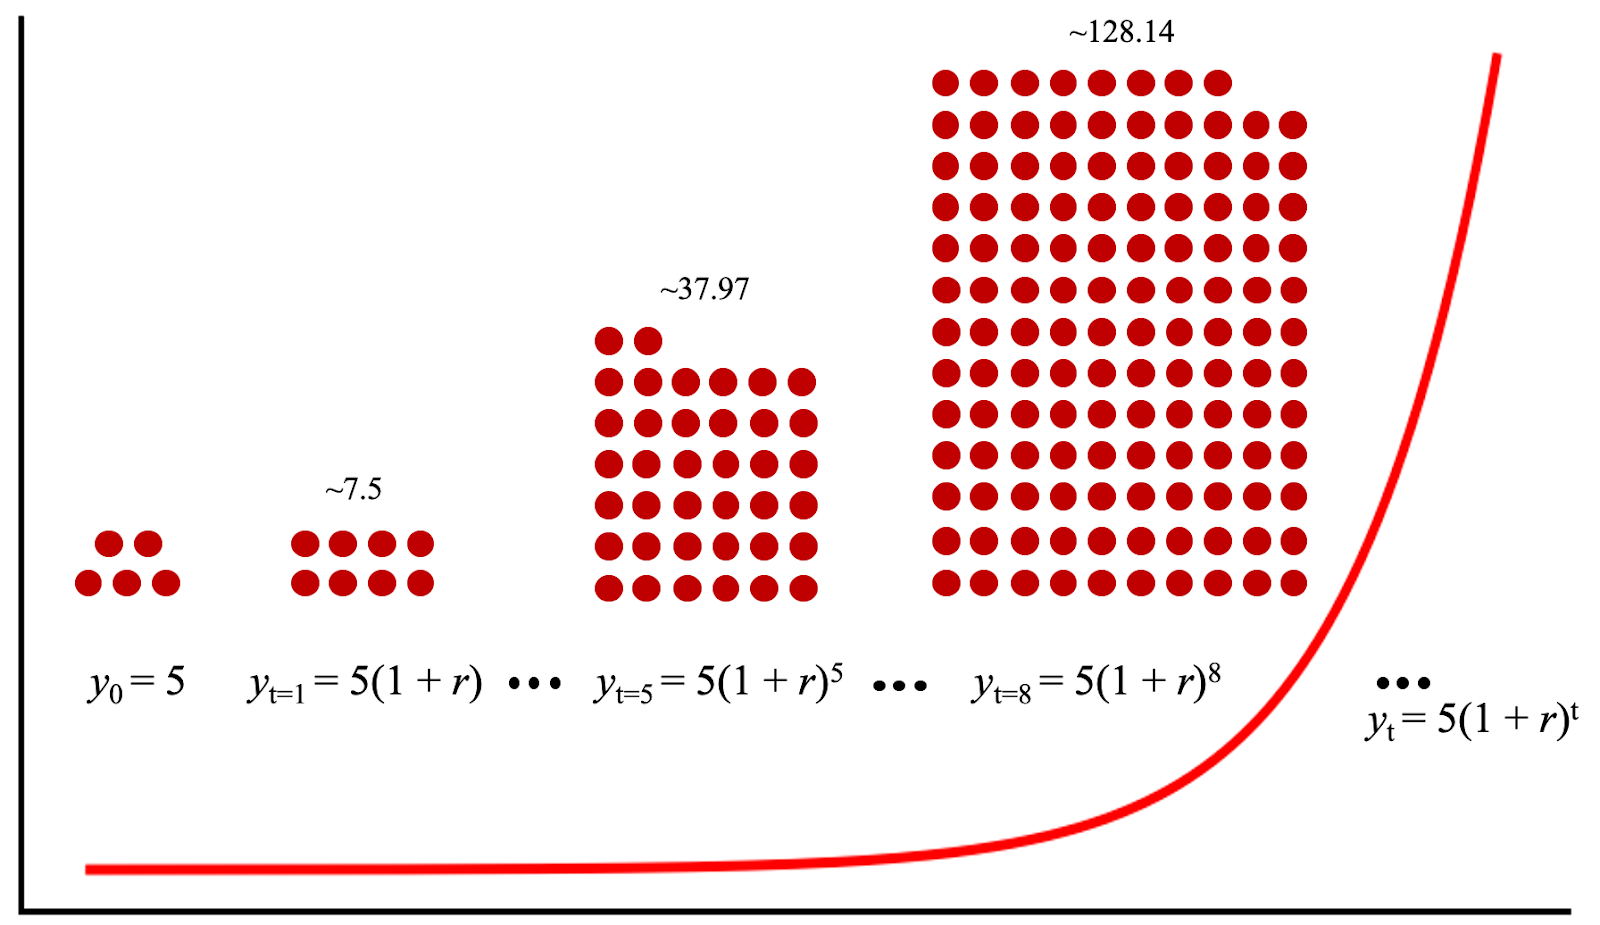
When do we expect to get an exponential distribution? Short answer is when the infection spreads at rate r that is proportional to the number of the infected population. This is a valid approximation as long as the number of infected individuals are far less compared to the total population.
For example, if there is y0 initial number of individuals infected at time t = 0, at time t = 1 this number will grow to y1 = y0 + ry0 = y0 (1 + r). For time t = 2, the total number of infected will be y2 = y1 + ry1 = y0 (1 + r)2. In general, we can get the number of infected individuals at time t using the formula: yt = y0 (1 + r)t. By some forces of mathematics, this can be expressed as an exponential: y(t) = a exp(bt) where the rate r = exp (b-1), and the doubling time is given by tdouble = ln(2) / ln (1 + r). We illustrate roughly the outcome below for r = 0.5 and y0 = 5.
As seen in all countries, for 10-14 days, such exponential trend has been preserved. What differentiates South Korea and Singapore from other countries was how the exponential trajectory was stunted in less than two weeks due to widespread virus testing and social distancing measures that were implemented early.
Will this trend change?
On Sunday morning at 12 am, Metro Manila was placed under community quarantine. And the following day, Monday, the entire Luzon was placed under an “enhanced” community quarantine. Will this be effective? Will this stunt the exponential growth we’re seeing, the way South Korea flattened its curve?
Probably. Hopefully.
We’ll only really know once we see changes in the trend (i.e., when we see the trend deviate from its current exponential growth curve) in the next week or so. We have observed that Italy eventually decreased the doubling period from an initial of 1.5 days to about 3.6 days in the last 10 days. If such is applied to the Philippine setting and we slow down the doubling to about 4 days, then the projection will be halved to about 805 cases by March 23 and 9,150 by March 30.
By how much could we be underreporting?
We can only speculate at this point.
However, using South Korea as baseline, the projection makes sense based on the following assumptions:
(1) the distribution in terms of age of that population holds
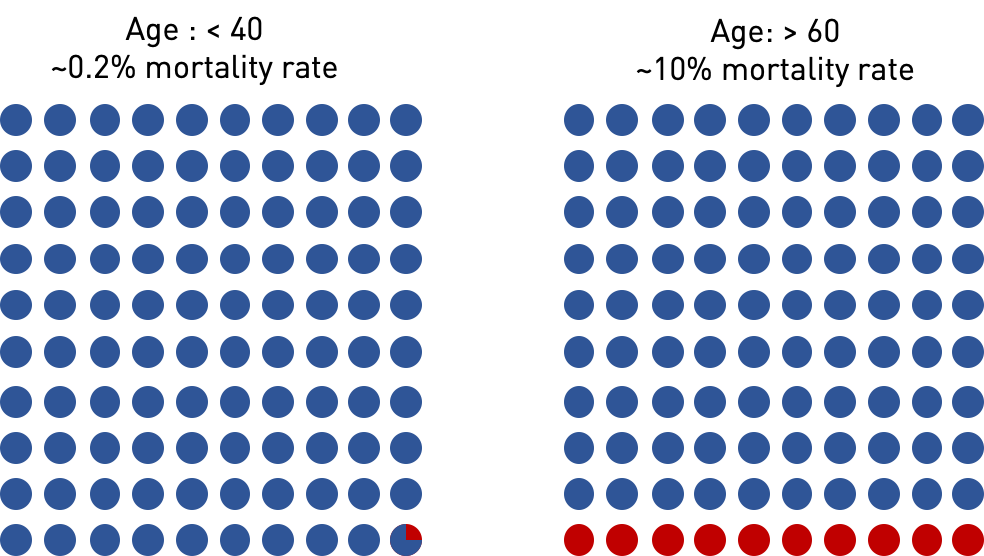
(2) only symptomatic patients are being tested in the Philippines (most probably 55+ and above).
This is because the age bracket 40 years and below only has ~0.2% mortality rate, while for 60 and above, the mortality rate shoots up to within 10%. This is a ~50 fold increase.
With such assumption, a first order approximation of the underreported cases in the Philippines is: Age below 55 (not tested) / Age above 55 (tested). Looking at the Philippine Statistics Authority data, this is about 90% / 10% or 9x. The assumption here is we are not detecting 9x of the infected because they are not going to hospitals for check-ups.
What now?
Of course, we could be wrong, and the good thing is that in the next few days we will be able to validate or invalidate our results. This is what science is all about! We will eventually know where we have gone wrong, and this will allow us to improve our model and forecast with new data coming in. But for the uncertain times ahead, our advice is to heed the lesson from Andrew Grove: right now, it is better to be paranoid to survive! – Rappler.com
*Christopher Monterola and Erika Fille Legara are Aboitiz Chairs in Data Science at the Aboitiz School of Innovation, Technology and Entrepreneurship of the Asian Institute of Management.
[1] DOH Press Release / 06 March 2020: DOH Confirms Two More Cases of COVID-19 in PH
[2] Stephen A. Lauer, et al. (2020) The Incubation Period of Coronavirus Disease 2019 (COVID-19) From Publicly Reported Confirmed Cases: Estimation and Application. Annals of Internal Medicine.
[3] Jovee Marie de la Cruz (2017) DOH admits lack of beds in Metro Manila hospitals. Business Mirror. Accessed on: 16 March 2020
Add a comment
How does this make you feel?
There are no comments yet. Add your comment to start the conversation.