SUMMARY
This is AI generated summarization, which may have errors. For context, always refer to the full article.
![[ANALYSIS] Where we stand in fight vs coronavirus: What DOH data tells us](https://www.rappler.com/tachyon/r3-assets/612F469A6EA84F6BAE882D2B94A4B421/img/870DD226F6774CB0B8671A276AA43A07/where-we-stand.jpg)

As we end the second month of what is now the world’s longest and probably most bizarre lockdown, it is timely to take stock of how the country is doing in the face of the pandemic.
The Department of Health (DOH) has been compiling detailed information on individual cases, availability of Personal Protective Equipment (PPEs) in hospitals, occupancy of hospital facilities, and tests conducted by accredited laboratories. From this dataset, I extracted 7 broad measures of the country’s progress in the fight against COVID-19.
I find that out of 7 measures, 6 suggest that the threat posed by COVID-19 has diminished considerably in the last two months, providing support to the total lifting of the ECQ (Enhanced Community Quarantine) and its mutations, and a shift in focus to reviving the economy.
Low and declining daily deaths and hospitalizations; rising recovery rate; falling infection rate; growing stockpiles of PPEs, and considerable idle capacity in hospitals – all point to the waning impact of the pandemic.
Only one measure suggests continued elevated risk from the pandemic: the number of confirmed cases.
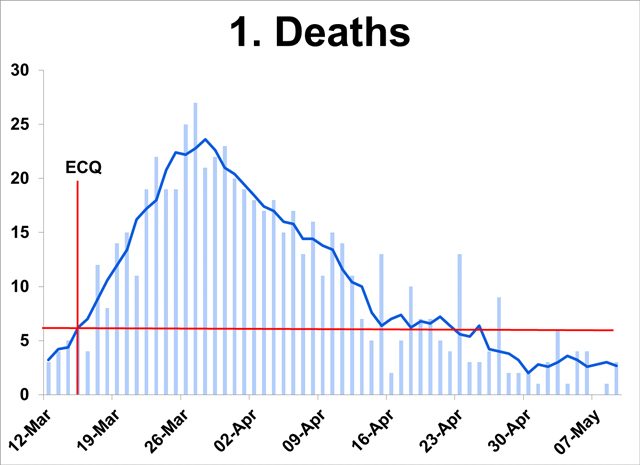
Declining deaths
- From a high of 24 in the last week of March, deaths have gone down to a daily average of 3, below the average at the start of the ECQ. (From hereon, average refers to 5-day moving average calculated as the average of the values on that day, and two days before and after.)
- Death lags infection by 3-9 weeks (WHO). Hence, rapid decline in deaths throughout April and May indicates earlier slowdown in infections in the population.
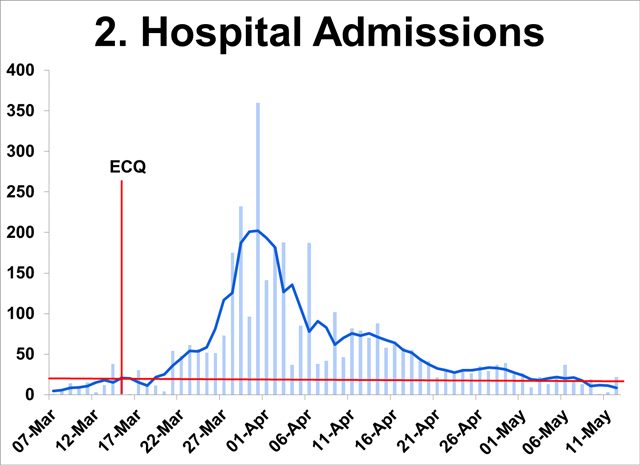
Low hospitalization
- From a peak of over 200 daily in first week of April, daily hospital admissions have dipped to 10 since May 9 – well below the March 15 level of 20.
- Sustained downtrend since end-March indicates declining infections in the population.
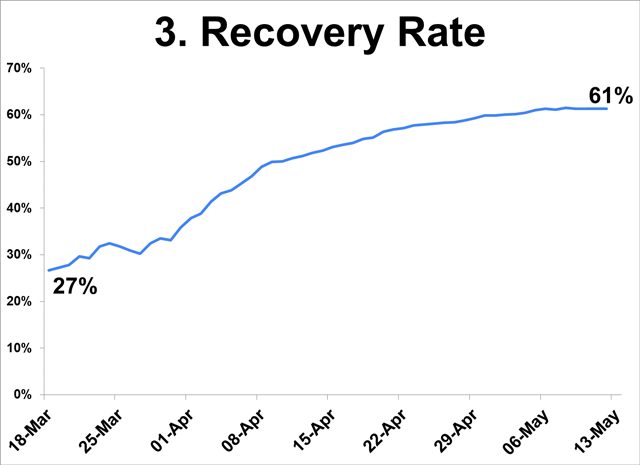
Rising recovery rate
- From 27% at the start of the ECQ, the recovery rate steadily improved to 61% on May 12.
- Referring to patients admitted in hospitals, daily recoveries (not shown) are going down, owing to low hospital admissions.
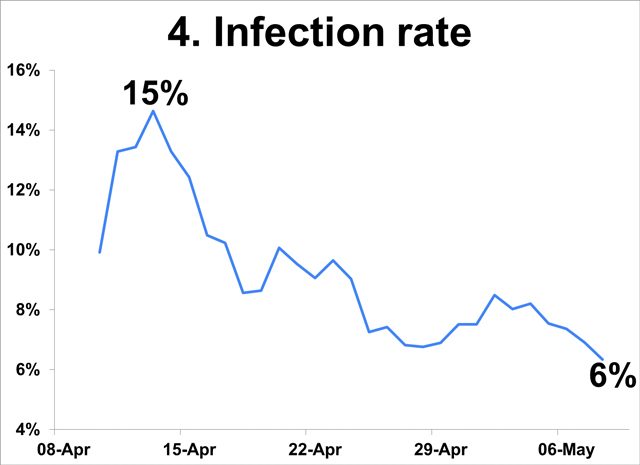
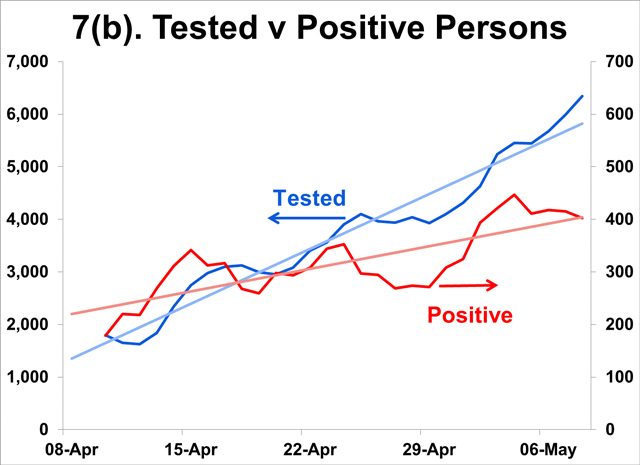
Declining infection rate
- Measured as the number of individuals with positive results over the number of individuals tested, the infection rate has dropped from 15% in mid-Apr to 6% early May.
- While this rate is not representative of the entire population, the decline in the indicators amid growing testing capacity suggest actual infections may be falling.
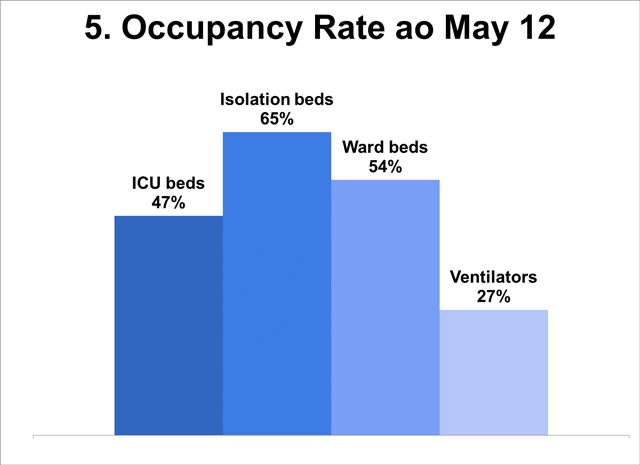
Low occupancy rate of hospital facilities
- Facilities reserved for the use of COVID-19 patients are underutilized: only two-thirds of isolation beds are occupied; half of ICU and ward beds are unused; only 1 of 3 ventilators is in use (max 30%).
- The significant underutilization can be traced to low hospital admissions as shown above; this can adversely affect financial viability of private as well as public hospitals.
- Given currently low occupancy rates, there is no basis for the IATF-IED requirement that private and public hospitals raise bed capacity and acquire ventilators (minimum health standards) – and to make this a condition for exit from the ECQ!
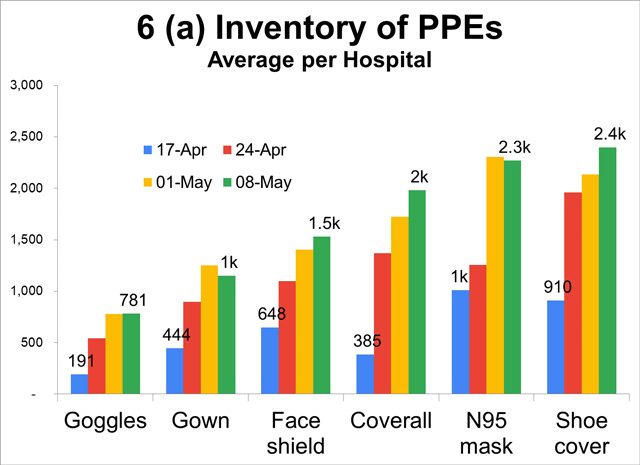
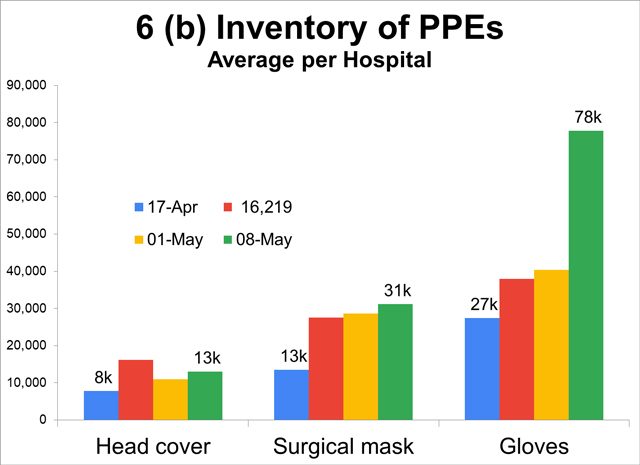
Accumulating PPEs in hospitals
- Stockpiles of PPEs are accumulating in hospitals. Inventory of PPEs in monitored hospitals more than doubled to tripled in the last month, indicating oversupply (e.g. 78,000 gloves per hospital).
- Not surprising since hospital admissions of COVID-19 patients have dwindled. Anecdotes abound of non-COVID-19 patients being rejected by hospitals and people avoiding hospitals for fear of contagion.
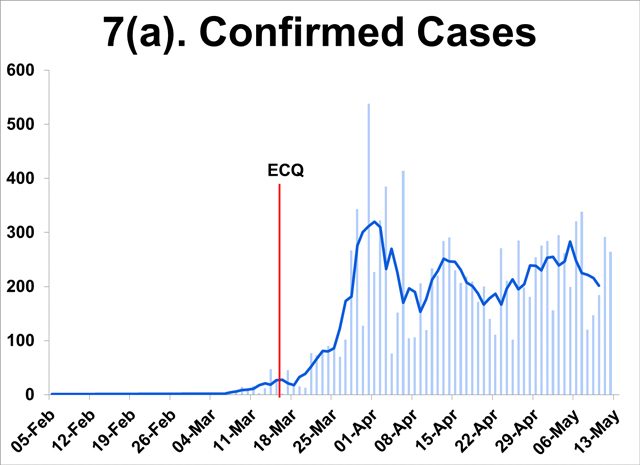
High confirmed cases
- This is the lone measure that suggests high risk remains. New cases have moved sideways in recent weeks, raising concerns of sustained widespread infection.
- Note, however, that the number of individuals testing positive has grown at a significantly slower pace than the increase in the testing capacity or the number of individuals tested.
- Adding to this concern is the growing gap between the number of positive cases identified by test results and the number of cases confirmed by the DOH, indicative of under counting of cases.
In assessing whether the country should get out of the lockdown, the government should consider not one but several measures of where we stand in the current pandemic.
The public’s obsession with the number of new cases arises from the fear and anxiety created by the lockdown. And there is no greater fear than fear of COVID-19 itself.
Least meaningful
Among the current measures, the number of new cases is probably the least meaningful, for two reasons:
First, the trend in this variable is confounded by increased testing capacity. The lack of visible improvement since mid-April is largely the result of improved capacity to test, of casting a wider net, thereby catching more cases. In fact the proportion of positive results to total tests conducted has been falling.
Second, SARS-CoV2 is highly contagious, hence we would expect it to be more widely spread than official figures indicate. Because more than 90% of cases are asymptomatic and mild, a large proportion is undetected. Increasing the number of tests will likely yield new cases.
The takeaway is that more indicators suggest that the pandemic has abated than there are indicators that suggest that we continue to face serious threat. While the DOH data tells us that the risks from the pandemic have diminished, evidence of the devastating impacts of the extended ECQ on the economy and the broader public health is mounting.
What should be done?
Clearly, the balance of risks has shifted and government must increasingly emphasize the need to restore normalcy in the economy and our daily lives.
But the biggest obstacle to a return to normalcy is fear and anxiety.
How can the government allay widespread fear and anxiety? A first step is to provide the public more meaningful information on where the country stands in the fight against COVID-19.
The current practice of reporting total and new cases, deaths, and recoveries can be improved to provide context and to reveal the trajectory of these variables over time. Presenting cumulative totals in graph form is not helpful as it is impossible even to the untrained eye to discern progress.
Because they never go down, a focus on cumulative totals is at best inappropriate in the current phase of the pandemic when the variables being monitored are going down. At worst, it is misleading and stokes fear and anxiety among an already panicked public.
The case of New York
New York City, for example, tracks 3 indicators – hospital admissions, people in ICUs, and percent of NYC residents who tested positive. They do not include the number of cases which is subject to changes in testing capacity, although it comes in as the numerator of the third indicator.
The daily numbers are presented as trends over time. Equally important, the city has set specific thresholds or targets for each of the variables being tracked, giving the public objective daily assessment of how the city is doing relative to those targets.
Given the available data, the government can start showing trends starting from peak to present for the following variables:
- daily deaths by date died (not date reported)
- new hospitalizations, and
- infection rate
Deaths and hospitalizations are the major outcomes that we want to prevent and be able to deal with adequately. The public must be informed that infection by itself is not a cause for alarm because in 90% if not 99% of cases COVID-19 is so mild people do not even realize they have it.
The aim of interventions is not so much to prevent spread, which is impossible to achieve, as to prevent cases from progressing to the severe or critical phases.
The third proposed indicator, the infection rate, is the percent of individuals testing positive on a given date. Threshholds for the chosen variables should be identified to serve as an objective basis for saying when the lockdown can be relaxed or completely lifted. – Rappler.com
Clarence Pascual is a consulting economist with a master’s degree from the UP School of Economics. He has worked with NGOs, and was former director at the Governance Commission for GOCCs and assistant secretary at the Housing and Urban Development Coordinating Council.
Add a comment
How does this make you feel?
There are no comments yet. Add your comment to start the conversation.