SUMMARY
This is AI generated summarization, which may have errors. For context, always refer to the full article.

For several years, Technical Staff of the (now defunct) National Statistical Coordination Board (NSCB) regularly released blogs meant to help the public realize that statistics matter to explain official statistics generated by the Philippine Statistical System.
A 2012 article for the NSCB Sexy Statistics blogs, for instance, discussed the relative concentration of single males to single females across the regions, based on results of the 2007 Census of Population, conducted by then National Statistics Office (NSO).
It has been nearly a year since my return to the Philippine Institute for Development Studies (PIDS) after the consolidation of Technical Staff of the NSCB, the NSO, and two other statistical agencies into the Philippine Statistics Authority (PSA). I thought it may be a good idea to revisit a discussion made in a 2013 article in an NSCB Beyond the Numbers blog that updated the 2012 article on the concentration of singles regarding results of the NSO’s 2010 Census of Population and Housing, and other related statistics regarding the “love month.”
In this 2013 NSCB article, it was pointed out that an examination of the household population 10 years old and over by sex (see Table 1) shows that single men outnumber single women.
In consequence, single Pinays in search of partners from the opposite sex should not have difficulty finding their Romeos. Since socio-demographic structures do not dramatically change, we expect similar results in 2015 (during the conduct of the mid-decade census by the PSA).
| Marital Status | Males |
Females |
Both Sexes |
| Single | 46.8 | 40.3 | 43.5 |
| Married | 45.0 | 45.8 | 45.4 |
| Widowed | 1.9 | 6.7 | 4.3 |
| Divorced/Separated | 0.9 | 1.6 | 1.2 |
| Common-Law/Live In | 5.3 | 5.5 | 5.4 |
| Unknown | 0.1 | 0.1 | 0.1 |
| Total | 100.0 | 100.0 | 100.0 |
Table 1. Distribution of Marital Status of Filipinos 10 Years Old and Over by Sex, 2010. Source: 2010 Census of Population and Housing, PSA.
The distribution of single Pinoys aged 10 and above in 2010 (see Table 2) indicates that a single female living in Eastern Visayas can find the most number of single males in her region, while a single male living in the Autonomous Region in Muslim Mindanao (ARMM) will have the best chance to find a single female in his region.
| REGION | Total Number of Single Males (aged 10 and above) | Total Number of Single Females (aged 10 and above) | Male to Female Ratio x 100 |
| Philippines | 16,758,227 | 14,394,867 | 116.4 |
| NCR | 2,145,448 | 2,109,576 | 101.7 |
| CAR | 321,641 | 267,782 | 120.1 |
| Region I | 854,597 | 709,889 | 120.4 |
| Region II | 560,230 | 445,126 | 125.9 |
| Region III | 1,767,704 | 1,488,474 | 118.8 |
| Region IV-A | 2,189,592 | 1,972,118 | 111.0 |
| Region IV-B | 491,482 | 389,765 | 126.1 |
| Region V | 1,015,651 | 812,683 | 125.0 |
| Region VI | 1,404,024 | 1,156,320 | 121.4 |
| Region VII | 1,254,452 | 1,089,335 | 115.2 |
| Region VIII | 771,121 | 603,806 | 127.7 |
| Region IX | 617,824 | 510,428 | 121.0 |
| Region X | 779,183 | 644,781 | 120.8 |
| Region XI | 814,731 | 660,123 | 123.4 |
| Region XII | 744,035 | 608,770 | 122.2 |
| Caraga | 451,639 | 358,464 | 126.0 |
| ARMM | 574,873 | 567,427 | 101.3 |
Table 2. Total Number of Single Males and Single Females and Sex Ratio of Filipinos aged 10 and above by Region: 2010. Source of basic data: 2010 Census of Population and Housing, PSA.
In this 2013 NSCB article, rather interesting information was also presented on the specific regions where Juliets have their best chances (see Table 3) of finding their Romeos.
| A SINGLE FEMALE AGED | WILL HAVE BEST CHANCE OF FINDING A SINGLE MALE AGED | ||||||
| 10-19 years old at | 20-29 years old at | 30-39 years old at | 40-49 years old at | 50-59 years old at | 60 and above at | 10 and above at | |
| 10 – 19 years old | REGION VIII | NCR | NCR | REGION VI | REGION VI |
REGION VI |
REGION VI |
| 20-29 years old | REGION IV-B | REGION VIII | REGION VI | REGION VI | REGION VI | REGION VI | REGION IV-B |
|
30-39 years old |
REGION IV-B | REGION IV-B | REGION IV-B | REGION IV-B | REGION IV-B | REGION VIII | REGION IV-B |
| 40-49 years old | ARMM | ARMM | REGION IV-B | REGION IV-B | REGION IV-B | REGION IV-B | ARMM |
|
50-59 years old |
ARMM |
ARMM | REGION XII | CAR |
CAR |
REGION IV-B |
ARMM |
|
60 and above |
ARMM | ARMM | REGION XI | REGION XI | REGION XI | REGION XI | ARMM |
| 10 and above | REGION IV-B | CAR | REGION VI | REGION VI | REGION VI | REGION VI | REGION VIII |
Table 3. Regions with Highest Single Males Per Hundred Single Females Ratio, By Age Group: 2010. Source of basic data: 2010 Census of Population and Housing, PSA.
A single female aged 20-29 in 2010 would have the best chances of finding a single male within the same age bracket in Region VIII, while teenagers interested in having Romeos ten years their senior would have their best chances by looking in Metro Manila. A “cougar” Juliet (i.e., one from a high age group) would have very good chances of finding her Romeo in ARMM.
Similarly, single males can examine distributions of single females across the regions to maximize their chances of finding a partner.
If single males prefer lady senior citizens, they would find it easiest to locate their Juliets in the Ilocos Region, while if they are aged 20 and above and are looking for Juliets who are below 30, then it would be best for them to scout around in ARMM (see Table 4).
However, in the wake of the rather sad events in Maguindanao, I am not sure how many males would like to migrate to ARMM.
| A SINGLE FEMALE AGED | WILL HAVE BEST CHANCE OF FINDING A SINGLE FEMALE AGED | ||||||
| 10-19 years old at | 20-29 years old at | 30-39 years old at | 40-49 years old at | 50-59 years old at | 60 and above at | 10 and above at | |
| 10 – 19 years old | ARMM | NCR | NCR | NCR | NCR |
REGION I |
NCR |
| 20-29 years old | ARMM | ARMM | NCR | NCR | NCR | REGION I | ARMM |
|
30-39 years old |
ARMM | ARMM | ARMM | NCR | NCR | REGION I | ARMM |
| 40-49 years old | ARMM | ARMM | ARMM | ARMM | ARMM | REGION I | ARMM |
|
50-59 years old |
ARMM |
ARMM | ARMM | ARMM |
ARMM |
REGION I |
ARMM |
|
60 and above |
ARMM | ARMM | ARMM | NCR | NCR | REGION I | ARMM |
| 10 and above | ARMM | NCR | NCR | NCR | NCR | REGION I | ARMM |
Table 4. Regions with Highest Single Females Per Hundred Single Males Ratio, By Age Group: 2010. Source of basic data: 2010 Census of Population and Housing, PSA.
However, being single certainly does not always mean being “ready to mingle” as some of these singles may have already have partners.
One of my former research assistants at PIDS said though that “mas masarap hulihin ang manok na nakatali sa bakod ng kapit-bahay, kaysa kumuha ng mga askal na pakalat-kalat sa kalye. (It is far more rewarding to catch a chicken tied in the backyard of our neighbor than to catch a stray dog on the streets.) A single female who read the 2013 NSCB article commented that some single males may not be available as they may be also interested in persons of the same sex.
Information on sexual preference is, however, not collected in censuses, and even if they were, it would be difficult to validate the veracity of such information regardless of the fact that we now live in a period of more tolerance on sexual preferences.
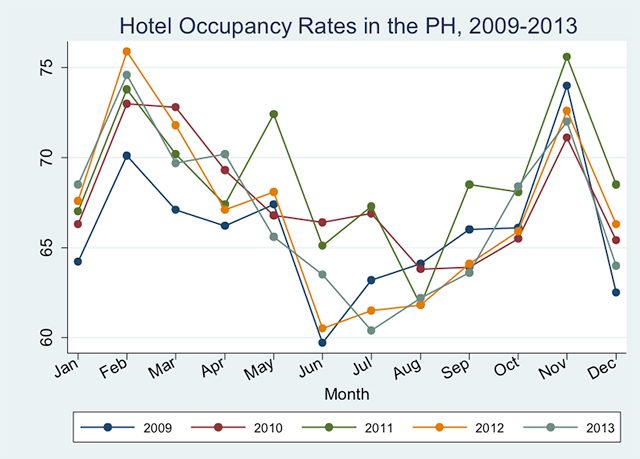
Hotels, motels
As Valentine’s Day fast approaches, some of us may not have needed to examine statistics from the population census anymore to find special people in our lives. Not only sales of red roses are spiking up because of Valentine’s Day celebration, but even hotel occupancy rates as shown in Figure 1.
Of course, the spike in these hotel occupancy rates may also be on account of the celebration of the Chinese New Year. Typically, February and November have the highest hotel occupancy rates within the 12 months of any given year, especially in the last few years. November rates are also high, likely because of the many holidays in November (e.g., All Saint’s Day, Bonifacio Day) as well as the semestral break.
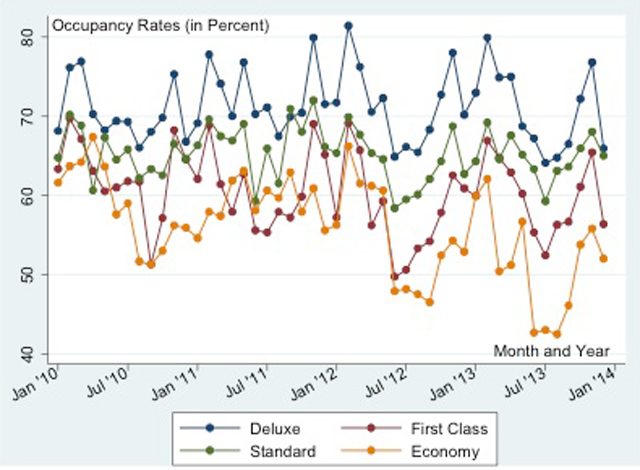
Across types of hotels in the country, monthly average occupancy rates have been the highest for February in the years 2012 and 2013.
In particular, for deluxe hotels, these rates have always been high in the years 2010 to 2013, even rising from 76% in 2010 to about 80% in 2013. For economy hotels, though, in 2011, February did not have substantially high rates compared to other months, and overall yearly performance in occupancy rates has even been decreasing.
Among deluxe, first class and standard hotels, trends have also not been rising across the years, and when these rates are compared to those in neighboring economies in ASEAN like Thailand (which has much higher occupancy rates and visitor arrivals), this may be suggesting that there is much to be desired about improving our competitiveness in tourism.
Our hotel industry in the country will clearly need to lower their daily charges to significantly improve on their occupancy rates. The Department of Tourism will need to influence our hotels to shape up, as we try to convince the world that “It’s More Fun in the Philippines.”
A warning though to heterosexual couples when they go spend a lot of time with their partners during the love month. Vital statistics produced by the PSA show that November is among the top three months when most live births are recorded for the 2010, (Table 5), which means these babies were very likely to have been made in February.
| Month of Occurrence | Number of Live Births | Rank |
| January | 151,110 | 5 |
| February | 133,514 | 12 |
| March | 143,584 | 8 |
| April | 137,949 | 10 |
| May | 140,675 | 9 |
| June | 134,040 | 11 |
| July | 147,921 | 7 |
| August | 152,478 | 4 |
| September | 173,063 | 1 |
| October | 165,797 | 2 |
| November | 153,268 | 3 |
| December | 149,582 | 6 |
| TOTAL | 1,782,981 |
Table 5. Monthly number of Live Births: 2010. Source of Data: Vital Statistics Division, PSA
Aside from November, the other months included in the top three are September and October, which means that the baby was likely conceived in December (or January) of the previous (or same) year. A June 2012 Sexy Statistics article by the NSCB suggested that more and more couples are choosing to be married in (May or) December, rather than June.
Just remember some prudent advice from Pope Francis that we should not be creating babies like rabbits, as every time we become co-creators, we have to think of our responsibilities about bringing a life into this world. – Rappler.com
The author thanks Joseph Bulan of the PSA for compiling some data updates in this article.
Dr. Jose Ramon “Toots” Albert is a professional statistician who has written on poverty measurement, education statistics, agricultural statistics, climate change, macro prudential monitoring, survey design, data mining, and statistical analysis of missing data. He is a Senior Research Fellow of the government’s think tank Philippine Institute for Development Studies, and the president of the country’s professional society of data producers, users and analysts, the Philippine Statistical Association, Inc. for 2014-2015.
Add a comment
How does this make you feel?
There are no comments yet. Add your comment to start the conversation.