SUMMARY
This is AI generated summarization, which may have errors. For context, always refer to the full article.

Five years ahead of the deadline set forth in the Millennium Development Goals (MDGs), extreme poverty was reportedly halved according to the World Bank.
This is the equivalent of 700 million people lifted out of extreme poverty since 1990.
Extreme poverty is defined in terms of having incomes less than $1.25 per person per day in 2005 prices. The most notable reduction in extreme poverty across the world came from developing countries in the East Asia and the Pacific, where extreme poverty was as much as 80 percent lower.
Sadly, around one billion people still live with incomes less than $1.25 a day. This is why, in recognition of an unfinished agenda as regards the MDGs, there are current discussions regarding the Sustainable Development Goals. There is a push toward “Getting Down to Zero,” reaching a world with zero poverty by 2030.
Beyond GDP
From 1990 to 2010, world income growth (measured by gross domestic product) averaged at 2.7 percent. Growth is recognized by many development analysts to be essential for poverty reduction, but the current economic growth in the Philippines has not translated into substantial income poverty reduction, at least not yet.
Economic growth, while important, is, by itself, not sufficient. Development goes beyond economic performance, so we do need measures beyond the GDP.
In fact, the former King of Bhutan has led efforts to measure Gross National Happiness (GNH), although the measurement of GNH is still a work in progress. There is a movement to come up with various measures of progress beyond the GDP.
The growth in GDP only measures economic performance. Dividing GDP by the population yields GDP per capita, which is hardly a measure of progress. Measures of progress beyond the GDP such as the Human Development Index, the Social Progress Index, have been proposed but clearly, these cannot replace the conventional monetary measures (of the GDP and of income poverty rates) but rather complements these economic measures.
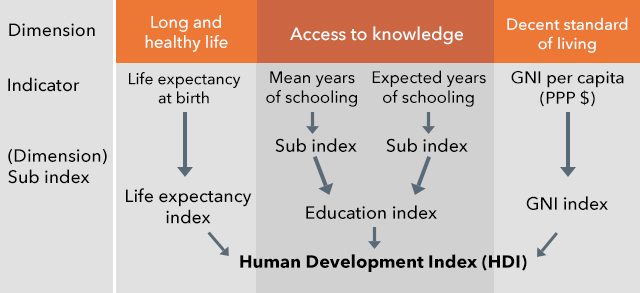
The UN Development Programme (UNDP) advocates measurement of the Human Development Index (HDI), a summary measure of average achievement in key dimensions of human development, i.e., health, education and standard of living. The framework for HDI focuses on people, their opportunities and choices.
Figure 1. Structure of the Human Development Index and Sub Indices.
How useful is HDI?
The health dimension of the HDI is assessed by life expectancy at birth, while the education dimension is measured by the mean of years of schooling for adults aged 25 years and expected years of schooling for children of school entering age. Finally, the standard of living dimension of HDI is measured by gross national income per capita. The scores for the three HDI dimension indices are then aggregated into a composite index by way of a geometric mean. The index enables comparison of countries with similar level of development but with different human development outcomes.
In the 2000 Conference of the International Association of Official Statistics held in Montreux, Switzerland, many official statisticians across the world expressed concern about the usefulness of HDI.
It was also pointed out that the HDI is actually more useful for advocacy than for policy since policy priorities will still have to be determined sectorally. When the HDI changes, an examination of the components of the HDI will still be necessary to determine what has changed and what has not.
In addition, it has not been easy to justify how to put weights to the components of a composite index. One wonders whether composite indices merely add up apples and oranges.
Social progress
Another yardstick, the Social Progress Index (SPI), has been developed under the technical guidance of Professors Michael Porter from Harvard Business School and Scott Stern from the Massachusetts Institute of Technology.
The SPI measures a comprehensive array of components of social and environmental performance and aggregates them into an overall framework. Similar with the HDI, the SPI is based upon social outcomes, which determines the level of social progress achieved within a particular country. The stark difference is on the inclusion of other indicators such as institutional, environmental, equity and inclusion factors, among others.
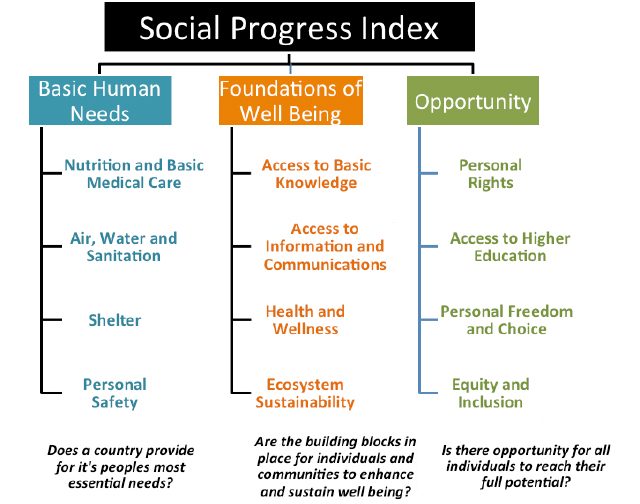
This SPI is based on three dimensions, each with four components. These three dimensions include basic human needs (such as nutrition and basic medical care, water and sanitation, personal safety and shelter); foundations of well-being (indicated by access to basic knowledge, access to basic information and communication, health and wellness, and ecosystem sustainability); and opportunity (echoed by personal rights, access to higher education, personal freedom and choice, equity and inclusion).
Each of the components of the three dimensions have a certain number of indicators that describe the components. All in all, 52 indicators are used to form the SPI.
Figure 2. Structure of the Social Progress Index.
However, there is also lot to be desired in the selection of the 52 indicators of the SPI, and in the weights employed. Equal weights are given to the indicators for each of the twelve components because as the SPI report says, “there is no clear theoretical or empirical reason to weight any of the components more highly.”
For instance, the Access to Information and Communications component of the index has four indicators that include fixed broadband subscriptions, Internet users, mobile telephone subscriptions, press freedom index. The Health and Wellness component considers six indicators which include life expectancy, obesity, cancer death rate, deaths from HIV, deaths from cardiovascular disease and diabetes, and availability of health care.
It is a puzzle why fixed broadband would be effectively given ¼ weight, but yet, life expectancy, would be given a 1/6 weight. Why would cancer deaths be given the same weight as life expectancy, and deaths from HIV? What really justifies the selection and use of the 52 indicators in the SPI? Why not examine the whole gamut of emerging 300+ SDG indicators that include indicators on income or asset inequality?
Measuring poverty beyond income
Poverty is typically measured by (a) identifying an indicator of the welfare of households (and consequently all members of the household); (b) setting a poverty line, a minimum acceptable standard of that welfare indicator (which effectively separates the poor from the non-poor); and (c) aggregating the poverty data.
The most common summary measure of poverty is poverty incidence, representing the proportion of households (or persons) that are considered poor. Poverty is not just about low consumption or low income; various welfare indicators such as access to public services, need to also be measured.
One could also generate a measure of “education poverty” based on years of schooling with a threshold of 4 years (since anyone with less than four years of schooling may be viewed as having inadequate education attainment required for decent work). Monetary poverty measures certainly need to be supplemented by other measures to get a complete picture of welfare.
Innovative measure
An innovative measure of poverty, the Multidimensional Poverty Index (MPI), was developed by Oxford Poverty and Human Development Initiative, with the UNDP.
The MPI identifies poor and non-poor population based on the number of deprivations a person experiences with respect to education, health and living standards. The index, just like the HDI, uses three broad dimensions of education, health and living standards.
Unlike HDI, the MPI is based on 10 indicators, two representing health (malnutrition, and child mortality), two are educational achievements (years of schooling and school enrolment), while six are indicators of “living standards” (including access to electricity, sanitation, safe drinking water, and proxies for household wealth, such as type of floor, cooking fuel, and some asset ownership).
Each dimension, and each indicator within a dimension, is weighted. In addition, the HDI uses aggregate country-level data, while the MPI uses micro data from household surveys, which are then aggregated to a national measure of poverty. The MPI measures the prevalence (i.e., how many people experience overlapping deprivations) as well as intensity (i.e., how many deprivations people experience at the same time) of deprivation.
The following 10 indicators are used for calculating the MPI:
Table 1. Dimensions and Indicators of the Multidimensional Poverty Index.
|
Dimension |
Indicators |
|
Education |
(each indicator is weighted equally at 1/6) a) Years of schooling: deprived if no household member has completed five years of schooling b) Child school attendance: deprived if any school-aged child is not attending school up to class 8 |
|
Health |
(each indicator is weighted equally at 1/6) a) Child mortality: deprived if any child has died in the family b) Nutrition: deprived if any adult or child for whom there is nutritional information is malnourished |
|
Standard of Living |
(each indicator is weighted equally at 1/18) a) Electricity: deprived if the household has no electricity b) Sanitation: deprived if the household’s sanitation facility is not improved (according to MDG guidelines), or it is improved but shared with other households c) Drinking water: deprived if the household does not have access to safe drinking water (according to MDG guidelines) or safe drinking water is more than a 30-minute walk from home roundtrip d) Floor: deprived if the household has a dirt, sand or dung floor e) Cooking fuel: deprived if the household cooks with dung, wood or charcoal f) Assets ownership: deprived if the household does not own more than one radio, TV, telephone, bike, motorbike or refrigerator and does not own a car or truck |
Persons are considered poor if they are deprived in at least a third of the weighted indicators. The intensity of poverty denotes the proportion of indicators in which they are deprived.
Unlike the conventional income-based measure of poverty, the MPI enables policymakers to have various dimensions of poverty by showing various aspects where poor are actually deprived as well as reveal the interconnections among these deprivations.
Key questions
The indicators used in the MPI though do not seem to have been chosen because they are the best available data on each of the three broad dimension of poverty. Rather they were chosen because the methodology used by the MPI requires that the analyst has all the indicators for exactly the same sampled household. That is, the indicators must all come from a single survey.
Reportedly, the Philippine Statistics Authority (PSA), is making plans to join the bandwagon of a few national statistics offices (NSOs) in developing countries that will be institutionalizing the production of MPI by having one survey yielding all the indicators for the MPI.
But is there really any policy use for the MPI, or are such measures going to be more for advocacy? The trends in these composite indices can make good academic reports and can serve to advocate for a better mix of policies, but whether these should be institutionalized in the national statistical systems of countries is rather questionable.
The Philippine Development Plan suggests the need for the MPI but one wonders whether the MPI has actually more hype than value added. Figure 2 shows that the MPI is very strongly correlated with SPI, HDI, and even with income poverty rates, although there are a few outliers.
This is somewhat expected since these composite indices involve indicators that are correlated with consumption or income, but these indicators, though, are not very likely to change much when there are economic fluctuations, such as global economic slowdowns or upswings in macro-economic performance. These indicators smooth out fluctuations in the SPI.
Figure 3. Graphical Interplay of Multidimensional Poverty Index with Social Progress Index, Human Development Index, GDP per capita (2013) and Poverty Rate (i.e., $1.25 per day) of 64 countries, various years.

Source of basic data: Social Progress Imperative, United Nations Development Programme, World Bank
When one examines composite indices, such as HDI, SPI, and MPI, one really wonders if this is an exercise to add “apples and oranges” without knowing the relative prices of the component indicators.
When one measures income or consumption poverty, one relies on economic theory, which says that under certain conditions market prices provide the correct weights for the aggregation of the poverty rate, but for the MPI, HDI and SPI, no consensus exists on how the multiple dimensions should be weighted to form the composite index.
When one considers the GDP, one considers a framework such as the 2008 System of National Accounts, advocated for implementation by the UN Statistics Division.
While poverty, welfare, and progress are multidimensional, it is unclear how composite indices, whether the HDI, SPI or MPI, can really contribute to better thinking about poverty and inequality, or better policies for eradicating poverty.
That these indices add up fundamentally different things in a rather arbitrary way suggests this may not be the way to go in poverty measurement. The PSA and NEDA will need to rethink its position about the MPI measurement in the Philippines.
While we have to recognize that there are important aspects of welfare that cannot be captured in the proportion of persons with income less than $1.25 per person per day, or even with the official poverty rates released by NSOs, neither can everything be put into a single index, whether the HDI, SPI or MPI.
These indices can show disparities across countries, or disparities within countries, which can be nice to know. But ultimately, policies will have to examine the specific components of these indices. How does one communicate a change in the indices other than by ultimately examining the components of the indices? So what then are these compositive indices ultimately for? – Rappler.com
Dr. Jose Ramon “Toots” Albert is a professional statistician who has written on poverty measurement, education statistics, agricultural statistics, climate change, macro-prudential monitoring, survey design, data mining, and statistical analysis of missing data. He is a Senior Research Fellow of the government’s think tank Philippine Institute for Development Studies (PIDS), and the president of the country’s professional society of data producers, users and analysts, the Philippine Statistical Association, Inc. for 2014-2015. He also teaches at De La Salle University, Holy Angel University and at the Asian Institute of Management.
Raymond E. Gaspar is a Research Specialist at Philippine Institute for Development Studies (PIDS) and is currently a Masters in Development Economics student at the UP School of Economics. Prior to working at PIDS, he worked at the National Economic and Development Authority, and at the now defunct National Statistical Coordination Board (NSCB).
Add a comment
How does this make you feel?
There are no comments yet. Add your comment to start the conversation.