SUMMARY
This is AI generated summarization, which may have errors. For context, always refer to the full article.
In more recent elections, voters from the National Capitol Region, highly educated, and middle class choose senatorial candidates that belong to political dynasties.
While much has been written about the prevalence of dynasties in Philippine politics and about the reservation that political dynasties are unhealthy for a democratic society, not much has been written about the profile of voters who choose candidates who belong to political clans. (READ: How much of our country will we lose to political dynasties in 2016?)
In a recently published book chapter, we examined the profile of the Philippine electorate who tended to vote for dynastic senatorial candidates. We analyzed SWS exit poll data from the 2001, 2004, and 2010 elections as well as an SWS pre-election poll in 2007.
Exit polls reflect voter-respondents’ choices of candidates after they have cast their votes. Sample sizes for these datasets range from 9,000 to 52,000.
We accounted for senatorial candidates who were members of national dynasties: they are the spouse or children of former or incumbent president, vice president, or senator.
The proportion of dynastic candidates running for Senate increased over the 4 election years. Four out of 37 senatorial candidates were members of national dynasties in 2001, 6 out of 41 in 2004, 8 out of 33 in 2007, and 13 out of 51 in 2010.
The urban, highly educated, middle class clusters
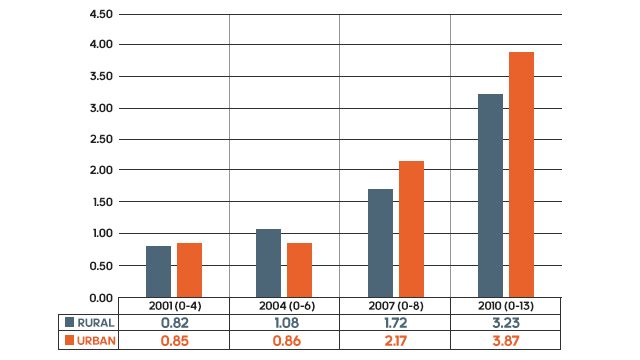
On average, while voters in rural and urban areas roughly picked the same number of senatorial candidates belonging to political clans in 2001, more recent elections showed that voters in urban areas chose a higher number of dynastic candidates than voters in rural areas.
Chart 1. Average number of dynastic candidates voted by urban and rural residences
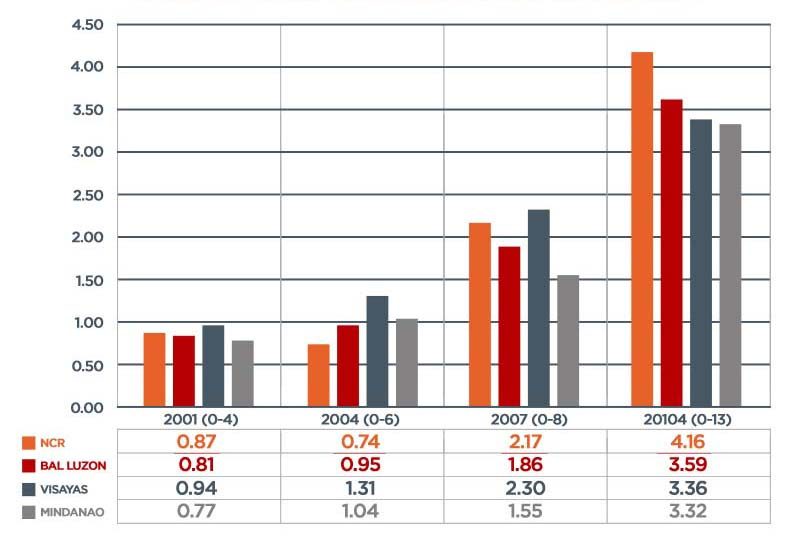
From 2001 to 2007, voters in the Visayas, on average, selected a higher number of senatorial candidates from political families. In 2010, however, selection of dynastic candidates was highest in the National Capitol Region than in any other area of the country.
Chart 2. Average number of dynastic candidates voted by area
Across the 4 election years, voters with some college education and beyond opted for more dynastic senatorial candidates, on average, than voters with elementary and high school educational attainment.
Chart 3. Average number of dynastic candidates voted by education
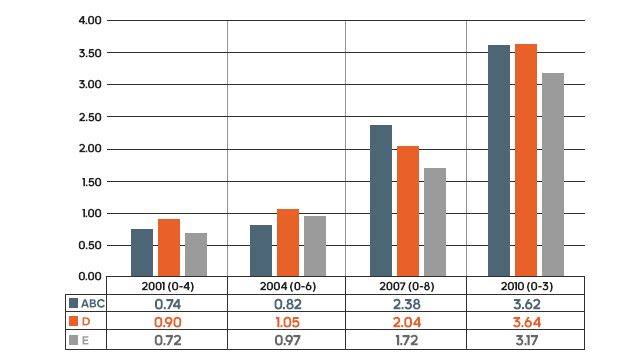
While these analyses showed that there is an increasing trend to vote for senatorial candidates from political families over the years across all social economic classes, the middle “D” class typically voted for more dynastic candidates than the other social economic classes.
Chart 4. Average number of dynastic candidates voted by social economic class
Need for further studies
Popular discussions about political dynasties revolve around the assumption that candidates belonging to political clans have a competitive advantage to win in national-level elections because a vast majority of the electorate vote based on name recall, which is associated with low levels of political knowledge, which is then linked with low levels of education and lower level of social economic classification.
The data, however, suggest that voters who are highly educated and those who belong to the middle classes are more likely to pick dynastic candidates. These patterns may not be the same for local-level races, where dynastic families are increasing their hold as each election passes. – Rappler.com
Editor’s note: An earlier version of this story showed renditions of Charts 1 and 4 with some differences from the original charts submitted by the authors. These have been corrected.
Notes: Data were collected by Social Weather Stations, Inc. This study was published as a book chapter in Building Inclusive Democracies in ASEAN (edited by R.U. Mendoza, et.al., 2015, Anvil Publishing Inc.)
Ma Rosel S. San Pascual is the chair of the Department of Communication Research of the UP College of Mass Communication.
Clarissa C. David is a Professor at the UP College of Mass Communication and a fellow of Social Weather Stations Inc.
Add a comment
How does this make you feel?
There are no comments yet. Add your comment to start the conversation.