SUMMARY
This is AI generated summarization, which may have errors. For context, always refer to the full article.
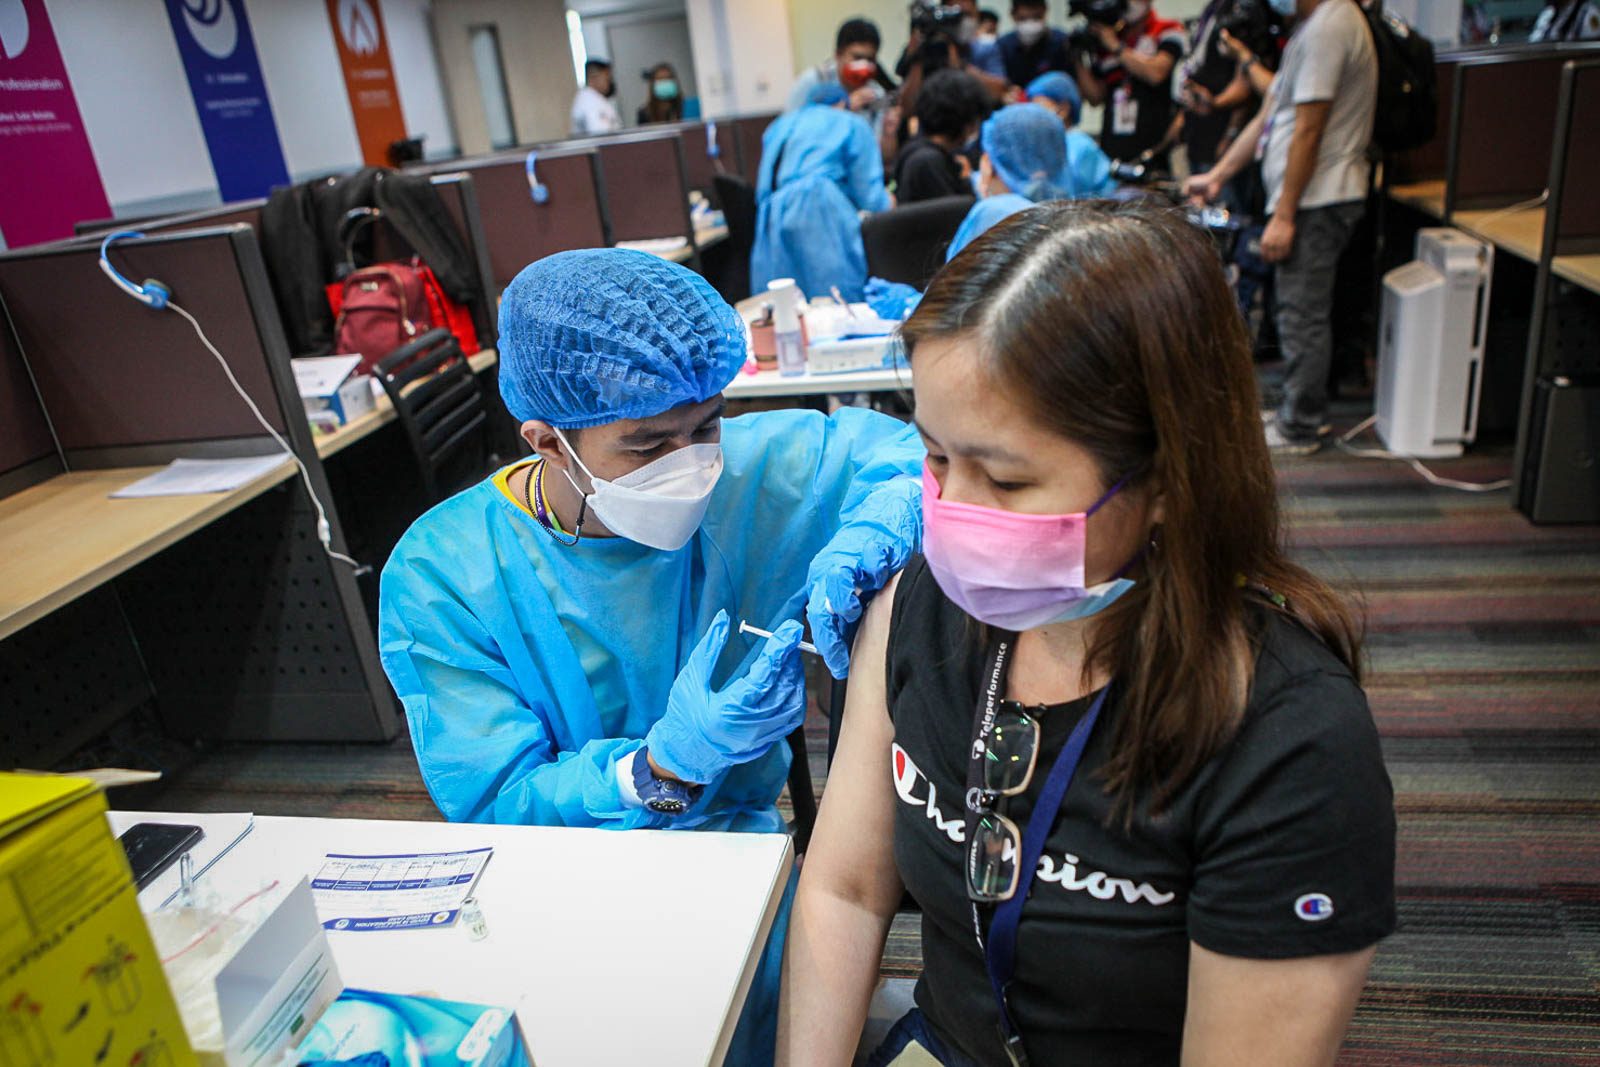
MANILA, Philippines – In an assessment of the country’s two-year experience with the pandemic, we saw geographic inequities in the distribution of health resources, services, and outcomes. Some regions did better than others in managing the COVID-19 outbreak. By comparing regions with each other, we learned valuable lessons in addressing health inequity.
National statistics of COVID-19 indicators do not give us a complete picture of the burden of disease in the population. Aggregate values often mask wide geographic differences in health status and resource allocation across the regions of the country. Determining the geographic distribution of COVID-19 interventions and outcomes will give us a more precise idea of these differences.
With the data we gathered, we were able to map out the inequities in vaccination coverage, contact tracing efficiency, the COVID-19 incidence rate, hospitalizations, and deaths found in the different regions of the country. We used a measure of inequality called the 20/20 Ratio, which compares the performance of the top 20% to the bottom 20% of the regions. Larger 20/20 ratios indicate larger inequities and vice versa. We calculated regional inequities in both health system interventions (vaccination, contact tracing) and outcomes (cases, hospitalizations, and deaths).
High vaccination rates in a few regions
Vaccinations have been the single most effective measure, whether pharmaceutical or non-pharmaceutical, in the prevention of COVID-19. It is highly effective in preventing COVID-19-related hospitalizations and deaths. Thus, a population’s vaccination coverage is an important measure of a country’s ability to fight and end the COVID-19 pandemic.
Vaccination coverage pertains to the percentage of eligible individuals who are fully immunized in a given region. Our data suggests that, as of March 31, 2022, the three regions with the highest vaccination coverage were the National Capital Region (NCR), Ilocos Region, and Central Luzon, with vaccination coverage rates of 89%, 65%, and 64%, respectively. The lowest vaccination coverage rates were found in Central Visayas, the Bangsamoro Autonomous Region in Muslim Mindanao (BARMM), and Soccsksargen, with rates of 51%, 22%, and 12%, respectively.
The vaccination gap between the top performers and lowest performers is quite wide. In this case, we found that the 20/20 ratio for vaccination coverage is 1.80 – that is, the top three regions have vaccination coverage that is 80% higher compared to the bottom three regions. With a gap this wide, national vaccination coverage rates can easily mask the level of population protection at the national level. Even though the Philippines has a nationwide vaccination rate of 67%, the majority of those vaccinations had been administered in the three regions mentioned.
If we want to build a more equitable immunity wall where no one is left behind, high vaccine rates cannot be limited to a few regions. As it is, our country’s immunity wall already has breaches because of incomplete vaccination rates among vulnerable groups.
We can speculate as to the causes of this inequity. The top performers in vaccination coverage may have received more vaccine supplies at a time when it was scarce, they may have better distribution systems, or they may have conducted more effective health literacy campaigns. For example, NCR and Central Luzon, which were economically important regions, were prioritized for distribution of scarce doses. More research, however, is needed to explain the disparities across regions. Although running a vaccine program is not easy, the inequitable distribution of resources compounds the difficulty of local governments already struggling with the implementation of a new vaccination program.

Varying capacities for contact tracing
At the beginning of the pandemic, contact tracing played a key role in slowing transmission by identifying exposed individuals and quarantining them as soon as possible after identification. Contact Tracing Efficiency is determined by the percent of identified close contacts – that is, people exposed to a COVID-19 patient – who were home-quarantined within 24 hours.
Our data suggests that the most efficient regions in contact tracing were the Cordillera Administrative Region (CAR), Ilocos Region, and Central Luzon, with contact tracing efficiency of 98%, 98%, and 96%, respectively. The regions with the lowest contact tracing efficiency were the Davao Region, the Zamboanga Peninsula, and Mimaropa, with contact tracing efficiency of 78%, 74%, and 70%, respectively. The 20/20 ratio is computed at 1.31. This indicates that the three most efficient regions are about 30% more efficient than the three least efficient regions.
Contact tracing is a resource-heavy endeavor in terms of its requirement for skilled manpower, communication, and facilities. We speculate that the best-performing regions may have the capacity to conduct better contact tracing due to the availability of facilities and technologies that can help facilitate quarantine. This is particularly so in CAR, where Baguio City is located. Those with lower contact tracing efficiency may be lacking these resources. It was also possible that contact tracing had no longer been prioritized in some regions once their outbreak was in the acceleration phase and contact tracing could neither be sustained nor be effective. More research is necessary to validate these explanations.

Population density a factor in COVID-19 cases
The COVID-19 incidence rate in a region determines the number of cases that have occurred per 1,000 population. It is also a measure of the proportion of the population who have been infected in the last two years.
The three regions with the highest incidence rate of COVID-19 are NCR, Calabarzon, and Davao Region, with rates of 90, 47, and 32 per 1,000 population, respectively. The three regions with the lowest incidence rate are Bicol, Mimaropa, and BARMM, with rates of 10, 9, and 8 per 1000 population, respectively. The computed 20/20 ratio was at 6.30. This means the regions with the highest incidence had six times more cases than the regions with the lowest incidence.
Population density may have played a role here. NCR, Calabarzon, and Davao Region contain densely-populated cities with highly-mobile populations, both of which are risk factors for the spread of COVID-19.

Hospitalizations are an indirect measure of severe illnesses
The rate of COVID-19 hospitalizations are an indirect measure of COVID-19 infection severity. More people admitted in hospitals due to COVID-19 indicate that the disease is causing more severe illness in the population. This could be caused by several factors: a population with a higher average age, a higher prevalence of comorbidities, or a lower rate of COVID-19 vaccinations. Hospitalizations are also a precursor to eventual COVID-19 deaths. Hospitalization rate may also be affected by health-seeking behavior and diagnostic capacity. Patients may also unnecessarily seek hospitalization due to lack of primary care services or perhaps hospitals were admitting patients with only mild-to-moderate severity.
Our data suggests that the regions with the highest hospitalization rates were Mimaropa, Northern Mindanao, and Eastern Visayas, with rates of 54%, 18%, and 17%, respectively. The regions with the lowest hospitalization rates were Calabarzon, Central Visayas, and Central Luzon, with rates of 6%, 4%, and 3%, respectively. The 20/20 ratio was 6.94 – that is, the three regions with the highest hospitalization rates have almost seven times the risk of hospitalization compared to the lowest three regions.
More research is needed to explain the gap in hospitalizations across these regions. The regions with the highest hospitalization rates have much lower case loads compared to the lowest performers; this is especially true for Mimaropa. It is possible that higher health-seeking behavior might have been a reason for higher hospitalization rates. Some regions may have more actively promoted seeking of hospital care, especially among those with risk factors. Or perhaps citizens were discouraged from seeking care because they thought that hospitals would already be at full capacity, especially in regions with few hospital beds available, as seen in Eastern Visayas.
An inability to practice home care management may have also prompted citizens to seek care immediately in their respective hospitals. It is also possible that hospitals were more geographically accessible in the regions with more hospitalizations. Lower hospitalization rates may have also been achieved from good vaccination. This may be the case for Central Luzon and Calabarzon. Again, further research is needed to explain these findings.

More deaths in regions with most urbanized cities
The prevention of deaths was the primary goal of the government response to COVID-19, which has killed around 6.3 million people globally. From a regional perspective, have local government units been able to save the lives of their citizens from the pandemic? The COVID-19 mortality rate can be seen as a summary measure of the impact of the pandemic. It is computed as the number of COVID-19 deaths that have occurred for every 10,000 population.
Our data suggests that the regions with the highest mortality were NCR, Davao Region, and Central Visayas, with mortality rates of 10.0, 8.7, and 8.6, deaths per 10,000 population, respectively. The regions with the least mortality per 10,000 individuals were Bicol, Eastern Visayas, and BARMM, with roughly the same mortality rates: 1.7 deaths per 10,000 population. The computed 20/20 ratio for mortality rate was 5.24. This means the three worst-performing regions had five times more deaths than the three best-performing regions.
It is worth noting that the three regions with the highest mortality also contain the most urbanized cities in the country. There is evidence suggesting that urbanized cities are more conducive to the development of comorbidities, which put COVID-19 patients at risk of death. It may also be that these regions have been unable to prioritize those with comorbidities for vaccination.

Inequity is the continuing pandemic
From this analysis, it is clear that the regions in the Philippines performed differently during the last two years. Although availability of resources most likely played a key role in determining a region’s capacity to handle vaccination, contact tracing, cases, hospitalizations, and deaths, there are other reasons yet to be uncovered.
Mapping these differences at the regional level shows us only a glimpse of the problems that the country faces. We have more questions than answers at this point in time. For example:
- Why do some regions have high hospitalization rates despite relatively high vaccination coverage?
- What is the true impact of vaccinations among all the regions?
- Does urbanization affect one’s risk of COVID-19?
- Is the lack of resource all there is to it or does efficiency in resource utilization play a role?
There is only so much one can uncover looking at data at the regional level. To further understand why inequities occur across the nation, granular data needs to be available for further study.
Government should work to understand the causes of health inequities across the country. These differences are not unique to COVID-19. For example, in 2019, 43% of notified TB cases, a measure of a well-performing surveillance system, came from only three regions: NCR, Central Luzon, and Calabarzon.
If inequity is not addressed, we will be faced with a similar situation should a new pandemic come our way: healing for some but not for others. Resources are scarce and the way they are allocated is reflective of the fairness of government. Furthermore, the government must evaluate existing and new health policies that might be found to contribute to inequity.
Government should integrate the measurement of social vulnerability in its ability to respond to public health emergencies. It is time for inequity to be recognized as a health problem on par with diseases and injuries. As a community, we are only as strong as our weakest link. – Rappler.com
All authors are staff of EpiMetrics Inc., a public health research institution focused on the achievement of health equity through rigorous and creative conception, execution, translation, and communication of health systems and policy research.
Add a comment
How does this make you feel?


![[OPINION] Beyond infrastructure: Ensuring healthcare access for the poor](https://www.rappler.com/tachyon/2024/03/tl-healthcare-access-03402024.jpg?resize=257%2C257&crop_strategy=attention)


![[Free to Disagree] Sabwatan ng mga doktor at drug companies](https://www.rappler.com/tachyon/2024/04/tl-sabwatan-doktor-drug-companies-April-22-2024.jpg?resize=257%2C257&crop=292px%2C0px%2C720px%2C720px)
There are no comments yet. Add your comment to start the conversation.