SUMMARY
This is AI generated summarization, which may have errors. For context, always refer to the full article.
The data are available – concerned citizens, watchdogs, IT professionals should study them, break down the numbers. And monitor PPCRV's random manual audit.
The first time I saw the spreadsheets showing the alleged 60-30-10 voting pattern, it also got me thinking. The totals over time seemed consistent indeed to my untrained eye.
What initially prompted me to question the so-called “pattern,” however, were results we extracted for precincts where attendance at the polls were either perfect or almost perfect. In those precincts, the candidates who landed on top 12 were different from the national results.
Two candidates who did not make the final line-up – Juan Ponce Enrile Jr and Juan Miguel Zubiri – ranked 6th and 7th in those precincts.
This considered, we decided to break the votes apart: by location (regions, provinces, cities and municipalities, and particular precincts) and by the performance of each candidate.
More differences showed up. Grace Poe, despite her strong showing across the country, was certainly not number 1 in all regions.
There were also differences in the configuration of the top 12 senators across cities and provinces.
We have so far reported on the breakdowns for regions and for the 25 key cities which have their own certificates of canvass.
Marked differences
The regional breakdowns indicate a variance of around 6% across 18 regions. This may not seem much to some, but consider this: 6% of 52 million voters is a big thing – that represents roughly 3 million votes.
Differences became more marked as we went further down.
Metro Manila departed from the 60-30-10 ratio by about 2.46%. Since Metro Manila has 5,961,912 registered voters, 2.46% translates to 146,663 voters.
In the cities, Team PNoy votes ranged from 50.59% of total votes for senator in Navotas to 64.35 percent in Iloilo City – a difference of 14%.
We did not stop there.
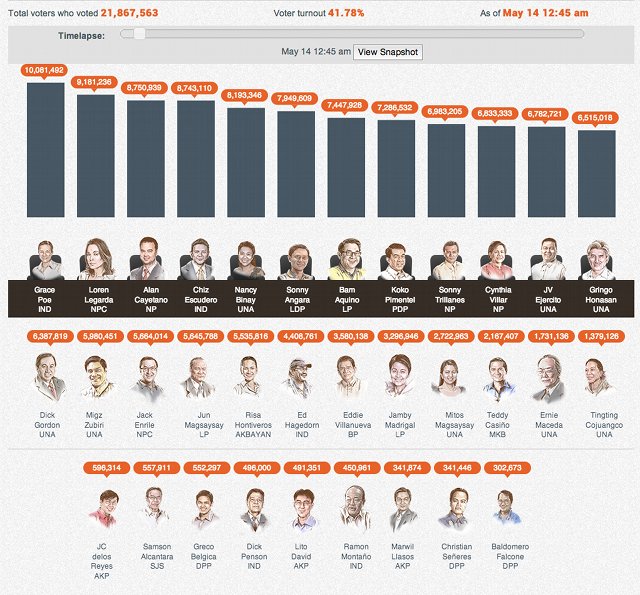
We reviewed the time lapse in our visualization of the results for the senatorial elections and noted that the initial snapshot was different from the final outcome: Liberal Party bet Ramon Magsaysay Jr. and United Nationalist Alliance’s Miguel Zubiri made it to top 12 in the first snapshot.
Both got booted out within the first hour of the live tally.

 I must note that there was a gap of almost an hour between the first file we published and the next update to the numbers in our time lapse.
During this hour, the Transparency Server of the Commission on Elections (Comelec), to which the Rappler Mirror Server was connected, was not churning out precinct-level data. What was being updated was the other file, which was known to those connecting to the servers as the “regions” file.
Rappler did not use this file because the Comelec and Smartmatic did not provide proper documentation on how to interpret the data that the file contained. The Parish Pastoral Council for Responsible Voting (PPCRV) did, and that was the cause of the counting error for which it later apologized.
Precinct-level results
We processed the next update, which was complete with precinct-level results at 8:37 pm. That update already counted 9,042,225 voters and reflected data from all 17 regions.
Those who were in the top 12 by that time until May 18, when the Comelec proclaimed the last 3 winning senators, were consistent: Poe, Legarda, Escudero, Cayetano, Binay, Angara, Aquino, Pimentel, Trillanes, Ejercito, Villar, and Honasan.
Still, there was a slight difference in the rankings. From 8:37 pm to past 12 midnight of election day, JV Ejercito was ahead of Cynthia Villar. Their ranking switched at 12:45am.
I must note that there was a gap of almost an hour between the first file we published and the next update to the numbers in our time lapse.
During this hour, the Transparency Server of the Commission on Elections (Comelec), to which the Rappler Mirror Server was connected, was not churning out precinct-level data. What was being updated was the other file, which was known to those connecting to the servers as the “regions” file.
Rappler did not use this file because the Comelec and Smartmatic did not provide proper documentation on how to interpret the data that the file contained. The Parish Pastoral Council for Responsible Voting (PPCRV) did, and that was the cause of the counting error for which it later apologized.
Precinct-level results
We processed the next update, which was complete with precinct-level results at 8:37 pm. That update already counted 9,042,225 voters and reflected data from all 17 regions.
Those who were in the top 12 by that time until May 18, when the Comelec proclaimed the last 3 winning senators, were consistent: Poe, Legarda, Escudero, Cayetano, Binay, Angara, Aquino, Pimentel, Trillanes, Ejercito, Villar, and Honasan.
Still, there was a slight difference in the rankings. From 8:37 pm to past 12 midnight of election day, JV Ejercito was ahead of Cynthia Villar. Their ranking switched at 12:45am.
 All in all, the variations by location, candidate performance, and time convinced me that we were either looking at one very complicated algorithm or a more simple explanation holds – that, as New York University’s Dean of Science Michael Purugganan explained, what appears to be a pattern is akin to a national survey where the sample size just got larger and larger.
Data converged at national average, Purugganan explained. “So every time you release a time result that’s just a national average, you are just getting more data that gives you a better and better estimate of the national result.”
To see at what point the results already reflected national sentiment, we queried the files we received. We looked at the number of election returns that the Rappler Mirror Server received from each province hour by hour.
Here’s how the table looks when zoomed out:
All in all, the variations by location, candidate performance, and time convinced me that we were either looking at one very complicated algorithm or a more simple explanation holds – that, as New York University’s Dean of Science Michael Purugganan explained, what appears to be a pattern is akin to a national survey where the sample size just got larger and larger.
Data converged at national average, Purugganan explained. “So every time you release a time result that’s just a national average, you are just getting more data that gives you a better and better estimate of the national result.”
To see at what point the results already reflected national sentiment, we queried the files we received. We looked at the number of election returns that the Rappler Mirror Server received from each province hour by hour.
Here’s how the table looks when zoomed out:
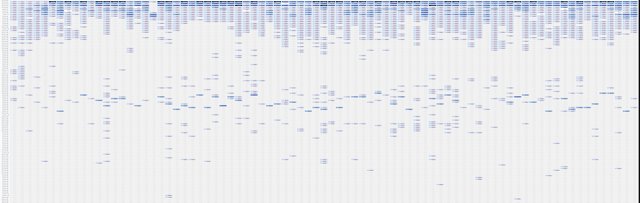 You can study the data received per province through the table below. This is another way to view data we published via our PCOS transmission map which also has its own time lapse.
What we saw from the files we received was that even on the first hour, the national totals already represented votes from all 80 provinces in varying degrees.
In fact, our time lapse shows that the first file the Rappler Mirror Server got, which we posted at 7:51 pm of May 13, was already sourced from 12 regions. These were the Autonomous Region in Muslim Mindanao, and regions 2, 3, 4-A, 5, 6, 7, 8, 9, 10, 11, and 12.
In my interview with Dean Purugganan, he mentioned that, even with a sample size of 10,000 votes, as long as they reflect what the national average should be, the variability is going to be very small.
This explanation, he said, also accounts for the fact that the line-up in the first data installment was different from the succeeding ones. It was still a small sample, so the estimate was not yet very good, according to Purugganan.
The initial file accounted for some 11,000 voters.
Glaring error
We examined the time-based data that 60-30-10 proponents have supposedly culled from the Rappler Mirror Server and we noticed one glaring error: they compared changes only every 12 hours, beginning on May 13, at 10:18 pm.
Only the first data set was taken on May 13, election night. The rest of it was taken during succeeding days.
By that time, the tally already started to slow down and the numbers were barely changing. In fact, by May 15, we noted that new precincts being added to the tally with each new file received was already down to single digit numbers.
I personally could not understand why they had to do it every 12 hours when we published updates several times an hour. Each update is accessible through the time lapse bar in our unofficial senate results visualization.
In May 2013 as in 2010, bulk of the data arrived during the first few hours after the polling centers closed on election night. Updates after that only came because there were still precincts that were not able to finish on election night for various reasons.
You must bear in mind that this is live data, triggered by movements on the ground.
There was a brief flurry of activity days after the elections. Our source at the Comelec attributed those to precincts which were able to finish counting after corrupted CF cards finally got delivered. Things quieted down again after that.
Teammate vs teammate
This brings me to my recommendations for those who are watching the automated elections.
First, disabuse yourself of the idea that the candidates were really working in teams.
The senatorial race, as any seasoned political operator will tell you, is free for all. There is fierce competition to get the top slot because that qualifies one for being considered “presidential timber.”
Those on the lower slots, on the other hand, need to be on guard not just against the candidates of the other party but also against his or her “team mates.”
Aquilino Pimentel Jr and Juan Ponce Enrile were both with the Lakas-Laban coalition when Pimentel accused Enrile of cheating in the 2005 mid-term elections.
The candidates who landed on the top 3 for the May 2013 elections were common candidates of the opposing slates.
After all, Grace Poe’s late father, Fernando Poe Jr, was former President Joseph Estrada’s best friend. And need we point out that Vice President Jejomar Binay also campaigned for FPJ?
Poe’s certificate of candidacy says she’s an independent.
We also know that in 2010, Sen Francis Escudero supported PNoy’s bid for the presidency but the VP bet he supported was Binay.
Loren Legarda lists her party as the Nationalist People’s Coalition. So does UNA candidate Jack Enrile.
The worst fallacy here, I think, is to even think that the senatorial candidates were working as a team. Many of them certainly did not campaign with their respective “teams.”
Study the data; they’re available
My second suggestion: study how the data flow into the system. Take advantage of available ways to double check data.
Each of the groups that conducted quick counts did their own sums and totals. And except for that one glitch with the PPCRV quick count at the outset, as well as differences in the speed at which each group processed data, the summaries were pretty consistent across the board.
The results that were transmitted to all groups that connected to the Transparency Server and the Rappler Mirror Server were granular down to clustered precinct level.
This made it possible for Rappler to churn out those stories on precinct-level results that looked odd. This is also why we released results down to precinct level.
This also makes it possible for each concerned voter to check if his or her vote really got counted.
Unfortunately, over 23 % of precinct level data have not yet made it into the system. We are still hoping the Comelec will give groups who took part in the quick count access to that remaining data.
Study the data carefully, do your own arithmetics, and make your own conclusions.
The precinct-level results are printed out before results are transmitted. A copy of the printouts are with the PPCRV. They are currently encoding those results. Volunteer if you really want to help.
One important thing that members of our data team at Pope Pius kept pointing out to me is this: garbage in, garbage out.
Unfortunately, because the source code arrived too late, we can never really know for sure what software actually operated the over 79,000 voting machines that were used on election day.
Whether there was cheating or not, this fact alone will forever cast doubt on the veracity of the results of these elections.
But the PPCRV is supposed to be doing a random manual audit. The report from that audit deserves to be monitored and made public to allay fears that the machines counted the votes wrongly.
And 3 years down the road, for the 2016 elections, IT professionals interested in clean elections should really make it a point to participate in the source code review. And the Comelec should make the process more open.
In future elections, there will always be people crying that they were cheated. Such is a fact of life in this country. But this will at least prevent more rational minds from latching on to wild hypotheses over simple patterns in the numbers. – Rappler.com
Gemma B. Mendoza heads Rappler’s Tech, Creatives & Research units, which produced Rappler’s real-time tally of the May 2013 election results. The same team worked closely with the Comelec to improve results data delivery to various groups, including major media networks, via the Rappler Mirror Server.
You can study the data received per province through the table below. This is another way to view data we published via our PCOS transmission map which also has its own time lapse.
What we saw from the files we received was that even on the first hour, the national totals already represented votes from all 80 provinces in varying degrees.
In fact, our time lapse shows that the first file the Rappler Mirror Server got, which we posted at 7:51 pm of May 13, was already sourced from 12 regions. These were the Autonomous Region in Muslim Mindanao, and regions 2, 3, 4-A, 5, 6, 7, 8, 9, 10, 11, and 12.
In my interview with Dean Purugganan, he mentioned that, even with a sample size of 10,000 votes, as long as they reflect what the national average should be, the variability is going to be very small.
This explanation, he said, also accounts for the fact that the line-up in the first data installment was different from the succeeding ones. It was still a small sample, so the estimate was not yet very good, according to Purugganan.
The initial file accounted for some 11,000 voters.
Glaring error
We examined the time-based data that 60-30-10 proponents have supposedly culled from the Rappler Mirror Server and we noticed one glaring error: they compared changes only every 12 hours, beginning on May 13, at 10:18 pm.
Only the first data set was taken on May 13, election night. The rest of it was taken during succeeding days.
By that time, the tally already started to slow down and the numbers were barely changing. In fact, by May 15, we noted that new precincts being added to the tally with each new file received was already down to single digit numbers.
I personally could not understand why they had to do it every 12 hours when we published updates several times an hour. Each update is accessible through the time lapse bar in our unofficial senate results visualization.
In May 2013 as in 2010, bulk of the data arrived during the first few hours after the polling centers closed on election night. Updates after that only came because there were still precincts that were not able to finish on election night for various reasons.
You must bear in mind that this is live data, triggered by movements on the ground.
There was a brief flurry of activity days after the elections. Our source at the Comelec attributed those to precincts which were able to finish counting after corrupted CF cards finally got delivered. Things quieted down again after that.
Teammate vs teammate
This brings me to my recommendations for those who are watching the automated elections.
First, disabuse yourself of the idea that the candidates were really working in teams.
The senatorial race, as any seasoned political operator will tell you, is free for all. There is fierce competition to get the top slot because that qualifies one for being considered “presidential timber.”
Those on the lower slots, on the other hand, need to be on guard not just against the candidates of the other party but also against his or her “team mates.”
Aquilino Pimentel Jr and Juan Ponce Enrile were both with the Lakas-Laban coalition when Pimentel accused Enrile of cheating in the 2005 mid-term elections.
The candidates who landed on the top 3 for the May 2013 elections were common candidates of the opposing slates.
After all, Grace Poe’s late father, Fernando Poe Jr, was former President Joseph Estrada’s best friend. And need we point out that Vice President Jejomar Binay also campaigned for FPJ?
Poe’s certificate of candidacy says she’s an independent.
We also know that in 2010, Sen Francis Escudero supported PNoy’s bid for the presidency but the VP bet he supported was Binay.
Loren Legarda lists her party as the Nationalist People’s Coalition. So does UNA candidate Jack Enrile.
The worst fallacy here, I think, is to even think that the senatorial candidates were working as a team. Many of them certainly did not campaign with their respective “teams.”
Study the data; they’re available
My second suggestion: study how the data flow into the system. Take advantage of available ways to double check data.
Each of the groups that conducted quick counts did their own sums and totals. And except for that one glitch with the PPCRV quick count at the outset, as well as differences in the speed at which each group processed data, the summaries were pretty consistent across the board.
The results that were transmitted to all groups that connected to the Transparency Server and the Rappler Mirror Server were granular down to clustered precinct level.
This made it possible for Rappler to churn out those stories on precinct-level results that looked odd. This is also why we released results down to precinct level.
This also makes it possible for each concerned voter to check if his or her vote really got counted.
Unfortunately, over 23 % of precinct level data have not yet made it into the system. We are still hoping the Comelec will give groups who took part in the quick count access to that remaining data.
Study the data carefully, do your own arithmetics, and make your own conclusions.
The precinct-level results are printed out before results are transmitted. A copy of the printouts are with the PPCRV. They are currently encoding those results. Volunteer if you really want to help.
One important thing that members of our data team at Pope Pius kept pointing out to me is this: garbage in, garbage out.
Unfortunately, because the source code arrived too late, we can never really know for sure what software actually operated the over 79,000 voting machines that were used on election day.
Whether there was cheating or not, this fact alone will forever cast doubt on the veracity of the results of these elections.
But the PPCRV is supposed to be doing a random manual audit. The report from that audit deserves to be monitored and made public to allay fears that the machines counted the votes wrongly.
And 3 years down the road, for the 2016 elections, IT professionals interested in clean elections should really make it a point to participate in the source code review. And the Comelec should make the process more open.
In future elections, there will always be people crying that they were cheated. Such is a fact of life in this country. But this will at least prevent more rational minds from latching on to wild hypotheses over simple patterns in the numbers. – Rappler.com
Gemma B. Mendoza heads Rappler’s Tech, Creatives & Research units, which produced Rappler’s real-time tally of the May 2013 election results. The same team worked closely with the Comelec to improve results data delivery to various groups, including major media networks, via the Rappler Mirror Server.
I must note that there was a gap of almost an hour between the first file we published and the next update to the numbers in our time lapse.
During this hour, the Transparency Server of the Commission on Elections (Comelec), to which the Rappler Mirror Server was connected, was not churning out precinct-level data. What was being updated was the other file, which was known to those connecting to the servers as the “regions” file.
Rappler did not use this file because the Comelec and Smartmatic did not provide proper documentation on how to interpret the data that the file contained. The Parish Pastoral Council for Responsible Voting (PPCRV) did, and that was the cause of the counting error for which it later apologized.
Precinct-level results
We processed the next update, which was complete with precinct-level results at 8:37 pm. That update already counted 9,042,225 voters and reflected data from all 17 regions.
Those who were in the top 12 by that time until May 18, when the Comelec proclaimed the last 3 winning senators, were consistent: Poe, Legarda, Escudero, Cayetano, Binay, Angara, Aquino, Pimentel, Trillanes, Ejercito, Villar, and Honasan.
Still, there was a slight difference in the rankings. From 8:37 pm to past 12 midnight of election day, JV Ejercito was ahead of Cynthia Villar. Their ranking switched at 12:45am.
All in all, the variations by location, candidate performance, and time convinced me that we were either looking at one very complicated algorithm or a more simple explanation holds – that, as New York University’s Dean of Science Michael Purugganan explained, what appears to be a pattern is akin to a national survey where the sample size just got larger and larger.
Data converged at national average, Purugganan explained. “So every time you release a time result that’s just a national average, you are just getting more data that gives you a better and better estimate of the national result.”
To see at what point the results already reflected national sentiment, we queried the files we received. We looked at the number of election returns that the Rappler Mirror Server received from each province hour by hour.
Here’s how the table looks when zoomed out:
You can study the data received per province through the table below. This is another way to view data we published via our PCOS transmission map which also has its own time lapse.
What we saw from the files we received was that even on the first hour, the national totals already represented votes from all 80 provinces in varying degrees.
In fact, our time lapse shows that the first file the Rappler Mirror Server got, which we posted at 7:51 pm of May 13, was already sourced from 12 regions. These were the Autonomous Region in Muslim Mindanao, and regions 2, 3, 4-A, 5, 6, 7, 8, 9, 10, 11, and 12.
In my interview with Dean Purugganan, he mentioned that, even with a sample size of 10,000 votes, as long as they reflect what the national average should be, the variability is going to be very small.
This explanation, he said, also accounts for the fact that the line-up in the first data installment was different from the succeeding ones. It was still a small sample, so the estimate was not yet very good, according to Purugganan.
The initial file accounted for some 11,000 voters.
Glaring error
We examined the time-based data that 60-30-10 proponents have supposedly culled from the Rappler Mirror Server and we noticed one glaring error: they compared changes only every 12 hours, beginning on May 13, at 10:18 pm.
Only the first data set was taken on May 13, election night. The rest of it was taken during succeeding days.
By that time, the tally already started to slow down and the numbers were barely changing. In fact, by May 15, we noted that new precincts being added to the tally with each new file received was already down to single digit numbers.
I personally could not understand why they had to do it every 12 hours when we published updates several times an hour. Each update is accessible through the time lapse bar in our unofficial senate results visualization.
In May 2013 as in 2010, bulk of the data arrived during the first few hours after the polling centers closed on election night. Updates after that only came because there were still precincts that were not able to finish on election night for various reasons.
You must bear in mind that this is live data, triggered by movements on the ground.
There was a brief flurry of activity days after the elections. Our source at the Comelec attributed those to precincts which were able to finish counting after corrupted CF cards finally got delivered. Things quieted down again after that.
Teammate vs teammate
This brings me to my recommendations for those who are watching the automated elections.
First, disabuse yourself of the idea that the candidates were really working in teams.
The senatorial race, as any seasoned political operator will tell you, is free for all. There is fierce competition to get the top slot because that qualifies one for being considered “presidential timber.”
Those on the lower slots, on the other hand, need to be on guard not just against the candidates of the other party but also against his or her “team mates.”
Aquilino Pimentel Jr and Juan Ponce Enrile were both with the Lakas-Laban coalition when Pimentel accused Enrile of cheating in the 2005 mid-term elections.
The candidates who landed on the top 3 for the May 2013 elections were common candidates of the opposing slates.
After all, Grace Poe’s late father, Fernando Poe Jr, was former President Joseph Estrada’s best friend. And need we point out that Vice President Jejomar Binay also campaigned for FPJ?
Poe’s certificate of candidacy says she’s an independent.
We also know that in 2010, Sen Francis Escudero supported PNoy’s bid for the presidency but the VP bet he supported was Binay.
Loren Legarda lists her party as the Nationalist People’s Coalition. So does UNA candidate Jack Enrile.
The worst fallacy here, I think, is to even think that the senatorial candidates were working as a team. Many of them certainly did not campaign with their respective “teams.”
Study the data; they’re available
My second suggestion: study how the data flow into the system. Take advantage of available ways to double check data.
Each of the groups that conducted quick counts did their own sums and totals. And except for that one glitch with the PPCRV quick count at the outset, as well as differences in the speed at which each group processed data, the summaries were pretty consistent across the board.
The results that were transmitted to all groups that connected to the Transparency Server and the Rappler Mirror Server were granular down to clustered precinct level.
This made it possible for Rappler to churn out those stories on precinct-level results that looked odd. This is also why we released results down to precinct level.
This also makes it possible for each concerned voter to check if his or her vote really got counted.
Unfortunately, over 23 % of precinct level data have not yet made it into the system. We are still hoping the Comelec will give groups who took part in the quick count access to that remaining data.
Study the data carefully, do your own arithmetics, and make your own conclusions.
The precinct-level results are printed out before results are transmitted. A copy of the printouts are with the PPCRV. They are currently encoding those results. Volunteer if you really want to help.
One important thing that members of our data team at Pope Pius kept pointing out to me is this: garbage in, garbage out.
Unfortunately, because the source code arrived too late, we can never really know for sure what software actually operated the over 79,000 voting machines that were used on election day.
Whether there was cheating or not, this fact alone will forever cast doubt on the veracity of the results of these elections.
But the PPCRV is supposed to be doing a random manual audit. The report from that audit deserves to be monitored and made public to allay fears that the machines counted the votes wrongly.
And 3 years down the road, for the 2016 elections, IT professionals interested in clean elections should really make it a point to participate in the source code review. And the Comelec should make the process more open.
In future elections, there will always be people crying that they were cheated. Such is a fact of life in this country. But this will at least prevent more rational minds from latching on to wild hypotheses over simple patterns in the numbers. – Rappler.com
Gemma B. Mendoza heads Rappler’s Tech, Creatives & Research units, which produced Rappler’s real-time tally of the May 2013 election results. The same team worked closely with the Comelec to improve results data delivery to various groups, including major media networks, via the Rappler Mirror Server. Add a comment
How does this make you feel?
Loading
There are no comments yet. Add your comment to start the conversation.