SUMMARY
This is AI generated summarization, which may have errors. For context, always refer to the full article.
MANILA, Philippines – A tool developed by the Ateneo Center for Computing Competency and Research and the University of the Philippines Manila – National Telehealth Center is being used to predict outcomes for the spread of the coronavirus under different scenarios.
It is able to project the effect of variables such as quarantines, social distancing, and tests being done.
Called the Feasibility Analysis of Syndromic Surveillance using Spatio-Temporal Epidemiological Modeler (FASSSTER), the tool is used to generate data-based coronavirus forecasts, which became part of the basis for the the coronavirus Inter-agency Task Force (IATF) to recommend an extension of the enhanced community quarantine (ECQ) until April 30.
Before it was adapted to COVID-19 forecasting, the tool, launched in 2016, was used in disease forecasting for dengue, typhoid, and measles.
The tool mapped out 4 scenarios, with different lifting dates for the ECQ, and health system capability.
Health system capability is defined by testing capacity or the availability of test kits; testing centers with quantitative polymerase chain reaction machines, which detects the virus DNA; health workers who can perform testing; turnaround time for results; and the availability of health facilities, medical devices, and health workers.
These were the 4 scenarios that FASSSTER found:
-
No ECQ ever implemented – 2 million total cases by May 30
-
If the ECQ were to be lifted on April 14, with health system capability at 25% – 1.5 million total cases by July 31
-
If the ECQ were to be lifted on April 14, with health system capability at 50% – 15,000 total cases by May 4
-
If the ECQ were to be lifted on April 30, with health system capability at 75% – 6,800 by May 21
Based on FASSSTER data, the most crucial factor in flattening the curve is by expanding the capability of the health system. Scenarios 2 and 3 showed the ECQ lifting on the same day, April 14, but with scenario 2 at 25% health system capability, and scenario 3 at 50% health system capability. The difference showed a massive change in results, from 1.5 million cases at its peak on July 31 for scenario 2, and just 15,000 total cases at its peak on May 4 for scenario 3.
DOST explained the data: “The tool showed that the peak will reach around 2 million confirmed cases on May 30 if no ECQ was implemented. If, however, ECQ is lifted on April 14, with health capacity at 25%, cases will be slightly reduced to 1.5 million on July 31. If the health capacity is increased to 50%, at the same lift date, a huge decline in confirmed cases is predicted, which is now projected to reach 15,000 on May 4.”
Here’s a look at the user interface:
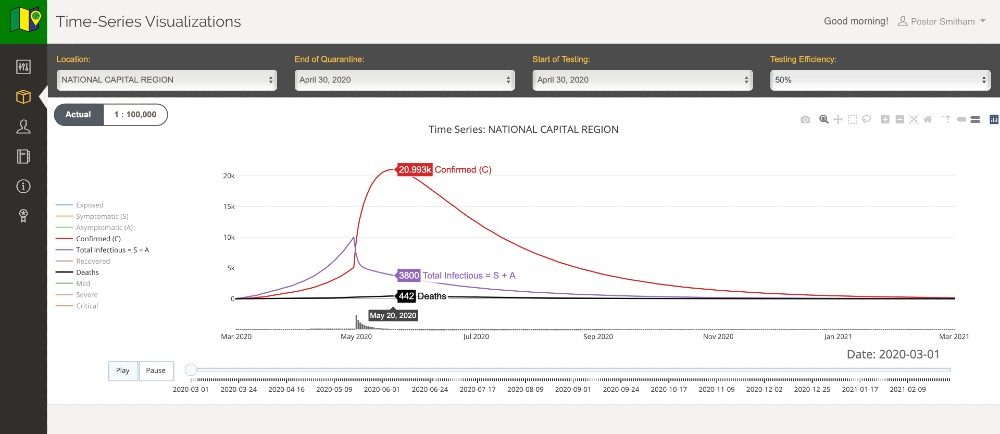
Peak date is the day with the highest number of active confirmed cases. The DOST, in its statement, explained that “peak date is an important factor for epidemiologists in assessing the spread of the virus – an epidemic starts to decline after the peak date.”
“The goal of the government is to ‘flatten the curve’ or to take the necessary preventive measures before hospitals and other healthcare facilities are overburdened with positive cases,” the agency reiterated.
The agency also said that strengthening the capacity of the health system against the pandemic is one of the most important goals of the extension of the ECQ
Funded by the Department of Science and Technology – Philippine Council for Health Research and Development (DOST-PCHRD), the DOST said the “data generated from this technology allows policymakers to understand the pandemic at the national, regional, and local levels; assess the effects of the preventive measures in place; and use best practices in specific communities.”
The FASSSTER tool is available to LGUs by registering on this link.
TanodCOVID
FASSSTER also has a contact tracing tool called TanodCOVID, a self-reporting application for COVID-19 and its symptoms, data from which is fed back into the FASSSTER system upon validation with local epidemiological surveillance units.
The DOST told Rappler data for this appears on the web tool in aggregated form, and individual-level data will not be shown.
They further explained the data protection checks in place for the system, for both TanodCOVID, and FASSSTER:
- The data received are de-identified (no names, complete addresses) and are only identifiable by using their case numbers (i.e. PH1, PH2).
- The LGUs who have their accounts only see aggregated data, NOT individual patient data.
- The data is already accessible to the public (see DOH’s NCov tracker: https://ncovtracker.doh.gov.ph).
- The website is secured with SSL encryption.
- Registration needs activation first before being granted access to sensitive data. Added to this, access is limited to users based on their location (LGUs only see data concerning their municipalities/cities) and based on their roles (health officers, managers, etc.).
– Rappler.com
Add a comment
How does this make you feel?
There are no comments yet. Add your comment to start the conversation.