SUMMARY
This is AI generated summarization, which may have errors. For context, always refer to the full article.
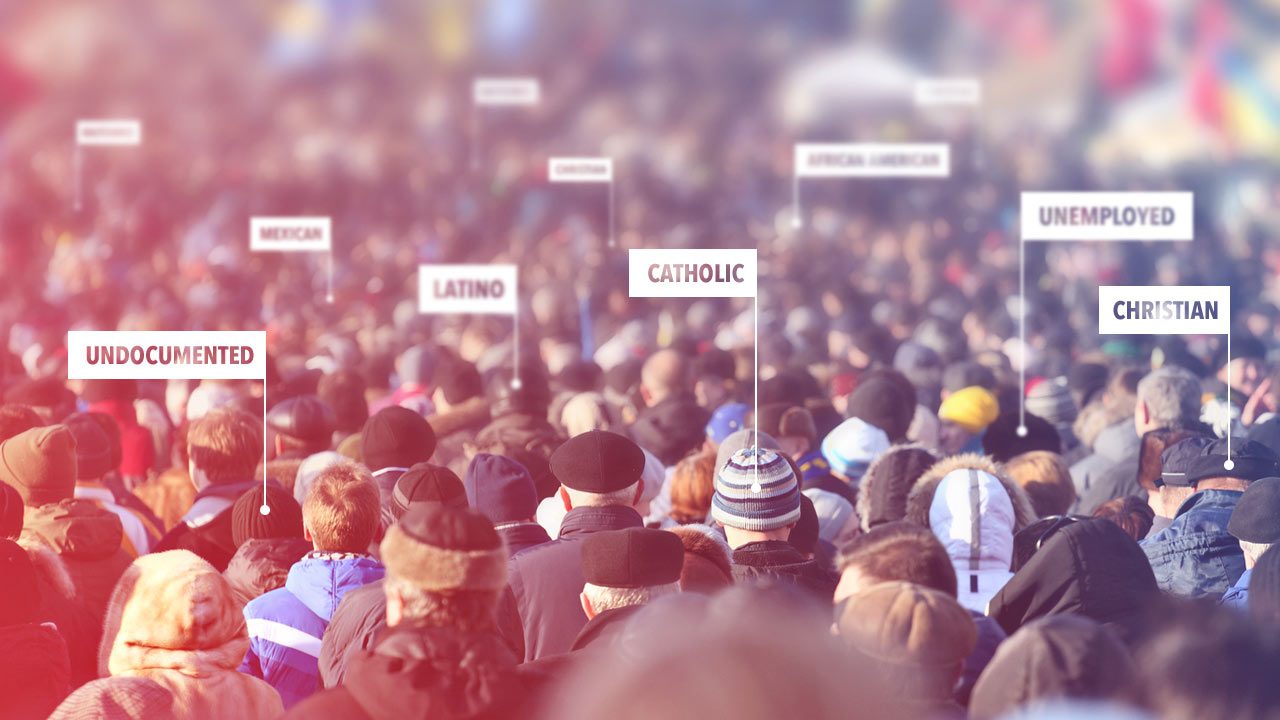
WASHINGTON DC, USA – As Americans count down to the 2016 presidential election, here are some key figures about the world’s biggest economy, where the role of immigration, minorities, growth and income disparity have all featured prominently on the campaign trail.
Number 1, or 3?
The United States is the world’s third largest country, both in terms of geographical size and population.
Both Russia and Canada cover more ground, while China and India count far more than America’s 325 million inhabitants.
The US economy nonetheless outpaces all others, with a gross domestic product of $17.9 trillion in 2015, well ahead of both China and Japan.
17.6% Latinos, 13.3% blacks
Non-Hispanic whites still represent a majority of the US population at 61.6%, but they are on the decline as the baby-boomer generation grows old.
Latinos comprise around 17.6% and have overtaken African Americans who now represent 13.3%. Asians account for 5.6% while Native Americans, including those from Alaska and Hawaii, comprise just 1.4%.
Eligible voters
Around 225 million people will be eligible to vote in the November 8 election.
Data from the 2012 presidential poll shows that only 71% of those eligible actually registered to vote, and just 53.6% of eligible voters cast ballots.
11 million undocumented
In 2014, legal immigration added 1.3 million people to the US population, an increase of 11% from the previous year.
The number of undocumented immigrants in the country is estimated at 11 million, most of whom are of Mexican origin. They are thought to number almost seven million in California alone.
5% unemployed
In September 2016, US unemployment stood at 5.0%, half the most recent peak recorded in 2009.
Median household income was $56,516 in 2015, an annualized rise of 5.2% and the first increase since the Great Recession of 2008.
The figure is still 1.6% lower than in 2007, when the global financial crisis first erupted, and 2.4% below the comparable level in 1999.
The rich get richer
In the three decades from 1983 to 2013, the median revenue of upper-income families in the US doubled from $318,100 to $639,400. That is 6.6 times that of middle-income families, which rose only slightly, from $94,300 to $96,500 in the same period.
Last year, 13.5% of US households lived below the poverty line with income of less than $15,391 for a couple.
The proportion of people living without health insurance edged lower in 2015 to 9.1% of the population, or 29 million people.
Religion
Almost 71% of US inhabitants described themselves as Christian in 2014, including nearly 21% who identified as Catholics and 47% as Protestant.
Jews accounted for nearly 2% of the population, double the rate of Muslims.
Those who checked the “unaffiliated” box represented almost 23%, a sharp increase from 2007, when they made up 16% of the American population. – Rappler.com
Sources: Census Bureau, Departments of Commerce, Health and Labor, Pew Research Center, World Bank
Add a comment
How does this make you feel?
There are no comments yet. Add your comment to start the conversation.