SUMMARY
This is AI generated summarization, which may have errors. For context, always refer to the full article.
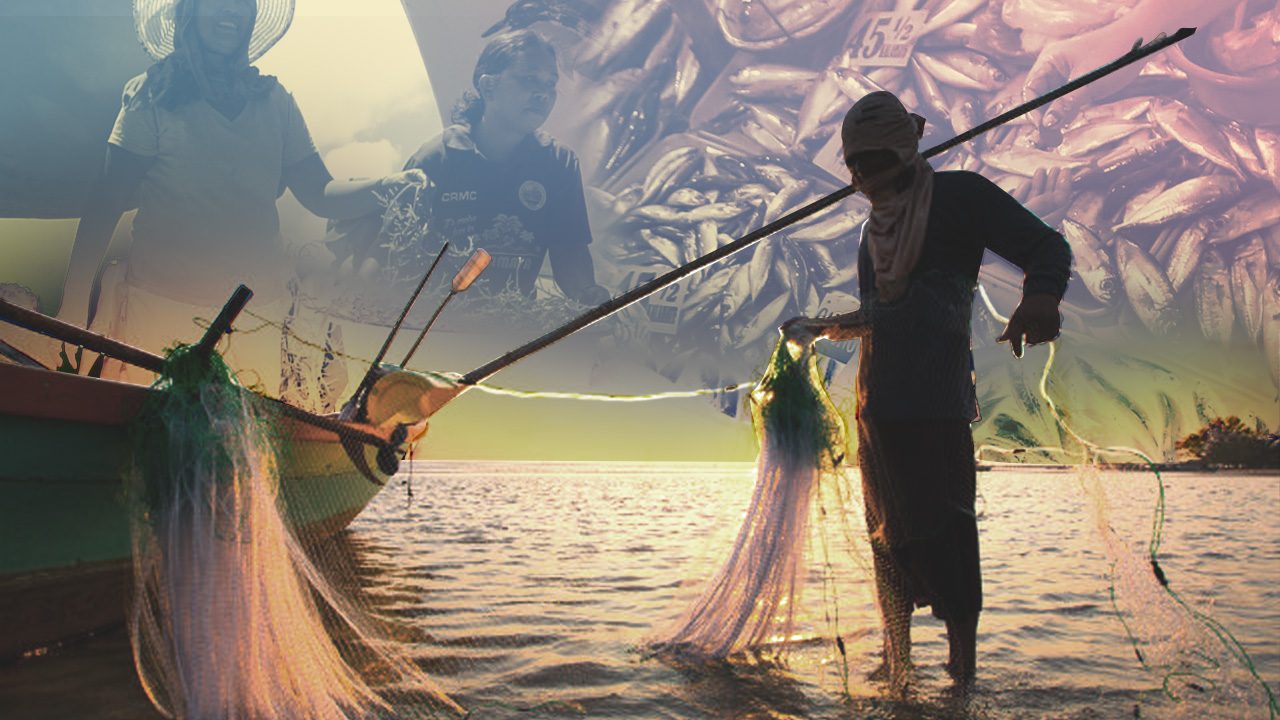
The Philippine archipelago is rich in marine and inland water resources that contribute to the country’s fisheries industry.
Every day, the country’s thousands of fisherfolk catch fish, engage in gleaning, raise aquatic resources through aquaculture, and sell their catch at markets. All these end up in Filipinos’ dinner tables or are exported, contributing to the country’s gross domestic product (GDP).
Below, we get to know the fisheries industry through data from the Philippine Statistics Authority (PSA), the Bureau of Fisheries and Aquatic Resources (BFAR), and the Food and Agriculture Organization (FAO) of the United Nations.
Total marine resources:
- Total territorial water area (including the exclusive economic zone): 2,200,000 square kilometers
- Shelf area (depth 200 meters): 18,460 square km
- Coral reef area: 27,000 square km
- Length of Philippine coastline: 17,460 km
Marine resources refer to the natural resources found in the country’s seas, bays, gulfs, channels, straits, and passages. In the Philippines, the West Sulu Sea is the largest major fishing ground at 29,993 hectares, followed by the the Moro Gulf (12,900 hectares) and the South Sulu Sea (12,642 hectares). These are located near Palawan, Zamboanga del Sur, Sulu, Tawi-Tawi, Maguindanao, and Sultan Kudarat.
Total inland resources: 646,336 hectares
This number includes swamplands, existing fishponds, and other inland resources. Laguna de Bay is the largest lake in the Philippines at 90,000 hectares, followed by Lanao Lake at 34,700 hectares and Taal Lake at 23,400 hectares.
Volume of fisheries production (2019): 4.415 million metric tons
Of this total in 2019, 53.42% came from aquaculture, 25.49% were from municipal fisheries, and 21.10% were from commercial fisheries.
In terms of areas, the Bangsamoro Autonomous Region in Muslim Mindanao (BARMM) contributed 21.19% of this amount, making it the biggest contributor to fisheries production in the Philippines in 2019. BARMM was followed by the Zamboanga Peninsula with 12.43% and Mimaropa with 11.35%.
In 2020, fisheries production volume decreased by -0.3%, according to preliminary statistics released by the PSA. The same preliminary statistics found that volume of production from municipal fisheries and aquaculture decreased, while production from commercial fisheries increased by 5%.
Value of fisheries production (2019): P281,652 billion
In 2019, aquaculture raked in the most money for the sector, taking up 41.84% of this total. It was followed by municipal fisheries at 35.63% and commercial fisheries at 22.54%.
Which regions brought in the most money for the fisheries sector that year? It was Central Luzon (14.75%), followed by Western Visayas (11.05%) and Soccsksargen (9.93%).
The most valuable species for aquaculture production in 2019 was milkfish, which brought in 36.4% of the total value. Squid and yellowfin brought in the most value to marine production at 9.8% of the total value, coming in second to “other” species. For inland fish production, tilapia brought in the most value at 25.8%, also coming in second to “other” species.
11th in marine capture production worldwide (2018)
- Percentage of total marine capture production worldwide: 2%
- Percentage of total inland capture production worldwide: 1%
According to data from 2018, the Philippines is among the 25 major producers of marine capture and inland capture in the world. That year, we ranked 11th out of the 25.
The Philippines’ rank has moved up since the 1980s, when we ranked 17th in total marine capture production worldwide. The country has steadily moved up over the years, ranking 15th in the 1990s, then 12th in the 2000s.
As of 2018, the 25 major producers of marine capture make up 80% of the world’s total. It includes China, which produces 15% of the world’s marine capture; Peru, which produces 8%; and Indonesia, which also produces 8%.
Meanwhile, the 25 major producers of inland capture make up 89% of the world’s total, including China (16%), India (14%), and Bangladesh (10%).
Number of fisherfolk engaged in capture fishing (2018): 927,612
Aside from capturing marine and inland resources, 239,483 fisherfolk were engaged in gleaning, 209,058 in aquaculture, 106,644 in fish vending, 34,880 in fish processing, and 384,129 in other fishing activities in 2018.
Impact on the economy
- Imports (2018): P35.373 million
- Exports (2018): P83.907 million
- Contribution to total GDP in 2018 (at constant prices): 1.3%
Despite the Philippines’ many marine and inland resources, the fisheries industry only contributes 1.3% to the country’s total GDP. – Rappler.com
Add a comment
How does this make you feel?


There are no comments yet. Add your comment to start the conversation.