SUMMARY
This is AI generated summarization, which may have errors. For context, always refer to the full article.
MANILA, Philippines – (UPDATED) Tropical depression Caloy has weakened into a Low Pressure Area (LPA), according to PAGASA’s weather bulletin as of 5pm, Saturday, March 22.
All storm warning signals are lowered. (SEE: #CaloyPH: Help map critical reports for Project Agos)
PAGASA reported that Eastern Visayas and Caraga will experiencce cloudy skies, with moderate to occasionally heavy rains and thunderstorms.
Meanwhile, Bicol region and the rest of Visayas and Mindanao will have cloudy skies, with light to moderate rainshowers and isolated thunderstorms.
Cagayan Valley and the province of Aurora will have cloudy skies with light rains.
While Metro Manila and the rest of Luzon will be partly cloudy to cloudy with isolated light rains or thunderstorms.
The coastal waters throughout the archipelago will be moderate to rough. Small fishingboats are still discouraged from moving into the seaboards of Northern Luzon and the eastern seaboards of Luzon and of Visayas. (Check this Live Blog for updates on #CaloyPH)
The map below shows which areas along Caloy’s track are susceptible to hazards. It is a snapshot of the geohazard maps produced by the Mines and Geosciences Bureau (MGB) – the government agency responsible for the management and development of the country’s mineral resources and lands.
Click on the image below to view the Philippine geohazard map on the MGB’s website.
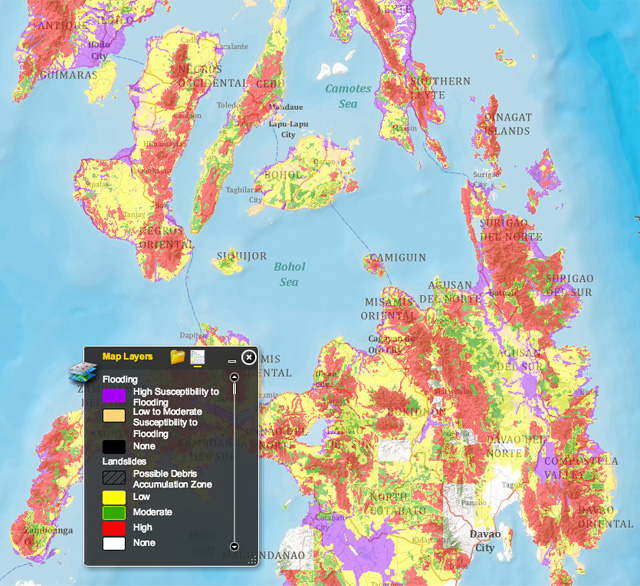
Landslides
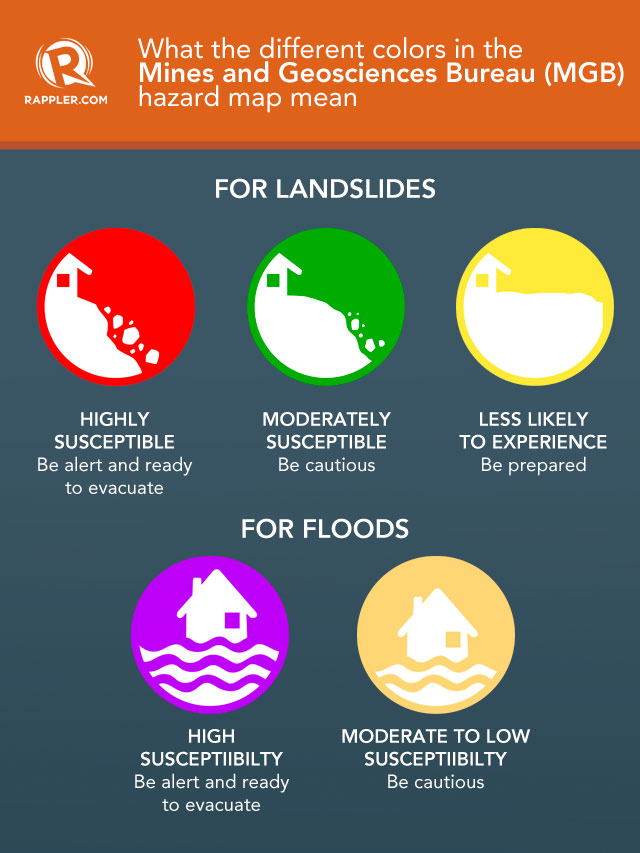
The landslide hazard map shows 3 colors – red, green, yellow. According to MGB Lands Geological Surgery Division OIC Lilian Rollan, the different colors show different levels of danger. People living in different colored areas also need different levels of preparation.
- Red areas area highly susceptible to landslides. If a storm passes through a red area, people need to be alert. When water saturates the area, a landslide will likely occur. According to Rollan, people living in red areas should always be ready to evacuate. The longer the rainfall, the more vulnerable the red areas become. Those in red areas are mountains with steep slopes, fractures and structurally weak rock formations with a history of landslides.
- Green areas are moderately susceptible to landslides. People living here, however, still need to be cautious. These are usually mountains and rock formations with moderate slopes.
- Yellow areas are less likely to experience landslides. Landslide debris, however, might still affect the areas as they might possibly be an accumulation zone.
Floods
The same hazard map also shows which areas are susceptible to floods and flashfloods. Rollan explained that:
- Violet areas have high susceptibility to floods. They are usually near bodies of water or prone to flashfloods. According to Rollan, residents in these areas must always be ready to evacuate.
- Light yellow areas have moderate to low susceptibility to floods. These areas, however, are still vulnerable to “dangerous debris flow.”
Changing environment
Rollan said the maps are prone to changes as “our environment is not static” – areas identified with low susceptibility can always progress to high susceptibility.
“People should always listen to warnings. MGB always provides advisories to local government units so the map can always be updated,” Rollan added.
The MGB website also gives the following disclaimer:
“The underlying data in this application was compiled from different sources, including Mines and Geosciences Bureau (MGB) and were obtained in different scales, thus accuracy of the geographic features and attributes cannot be guaranteed. Furthermore, the maps included in this application may be subjected to change and/or updates and for visual presentation only and cannot be used for other purposes.”
The resolution of the MGB geohazard map that is currently published on its website is at a scale of 1:50,000.
The bureau is currently working on a higher resolution map at a scale of 1:10,000. They are also creating a map for sinkhole susceptibility. – with a report from Gen Cruz/ Rappler.com
Add a comment
How does this make you feel?
There are no comments yet. Add your comment to start the conversation.