SUMMARY
This is AI generated summarization, which may have errors. For context, always refer to the full article.

MANILA, Philippines – It’s been 6 months since Super Typhoon Yolanda (Haiyan) hit the country and left a deep scar in affected areas, particularly in Eastern Visayas.
Yolanda tore across the Visayas on November 8 last year, leaving a huge number of casualties and damage. (READ: TIMELINE: Super Typhoon Yolanda (Haiyan))
This natural calamity made headlines around the world, leading other nations and organizations outside the country to provide various forms of assistance to assist in the country’s recovery.
The national government even released a total budget of P17.69 billion from December for the recovery and rehabilitation of communities devastated by the super typhoon.
After 6 months have passed, what progress has been made in the affected areas given all these assistance?
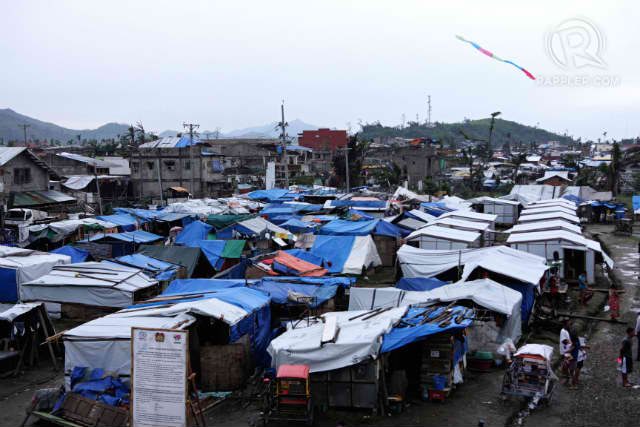
Rappler gathered the latest statistics from various agencies and organizations that monitored both the damage and aid in the areas hit by the super typhoon.
Click on each item below to see how each of them have been addressed so far.
| 1,472,251 | number of affected families |
| 918,261 | number of displaced families |
| 7,110,938 | number of affected individuals |
| 4,374,649 | number of displaced individuals |
| 518,878 | number of totally damaged houses |
| 493,912 | number of partially damaged houses |
| P11.07 billion | total foreign aid pledged (cash) |
| P22.97 billion | total foreign aid pledged (non-cash) |
| P15 billion | total cash received by government |
| 7,376 | number of individuals who benefitted from the cash-for-work program |
| P2.53 million | amount distributed under the cash-for-work program |
| 186,080 | number of individuals who benefitted from the cash-for-assets program |
| P531.68 million | amount distributed under the cash-for-assets program |
| 353,320 | number of Pantawid Pamilyang Pilipino Program (4P) household beneficiaries |
| 2.94 million | number of people at risk of undernutrition after the storm |
| 4,340,059 | number of distributed 3/6kgs family food packs |
| 713,074 | number of distributed 25kgs family food packs |
| 3.2 million | number of people reached by general food distribution |
| 466,290 | number of hygiene kits distributed |
| 329,270 | number of water kits distributed |
| 80,000 | number of houses that have been completely repaired or rebuilt |
| 140,000 | number of severely damaged houses that have been partially repaired |
| 3,455 | number of families in regions VI and VIII that have been transferred to bunkhouses |
| 265 | number of bunkhouses constructed in regions VI and VIII |
| 570,000 | number of households who have received basic emergency shelter materials such as tarps and tents |
| 133,000 | number of households that have received roofing materials, including corrugated iron sheeting, fixings and tools |
| 10,795 | number of families in Palo (Leyte), Tanauan (Leyte) and Guiuan (E. Samar) who received shelter kits |
| 2,553 | number of individuals trained as carpenters |
| 26,972 | number of households that received cash (below P10,000) to support shelter recovery |
| 10,733 | number of core shelter units (permanent houses in safe zones) to be constructed |
| P751.31 million | amount allotted for core shelter assistance |
| 331 | total number of ongoing developmental infrastructure projects that would help re-build Yolanda-affected areas |
| 85 | number of road projects (for construction/improvement/concreting) |
| 61 | number of foot path/access trail repair/construction |
| 53 | number of school building repair/construction |
| 37 | number of seawall/flood control/drainage/riprap/spillway repair |
| 35 | number of water system repair/construction |
| 20 | number of health station repair/construction |
| 16 | number of daycare center projects |
| 10 | number of bridge repair/construction |
| 5 | number of sanitary toilets repair/construction |
| 3 | number of post-harvest facilities repair/construction |
| 6 | number of other projects like multipurpose buildings, miniport, and solid waste management |
| P552.75 million | amount allotted for these projects |
| 109 | number of affected children verified through the Family Tracing and Reunification System |
| 65 | number of children who lost their parents/primary caregivers |
| 89 | number of children who need immediate financial assistance for daily needs |
| 163,000 | number of children under 5 who lost access to health facilities |
| 17,500 | number of schools destroyed |
| 25,000 | number of daycare centers destroyed |
| 48 | number of child friendly spaces established |
| 2,328 | number of women of availed of the Women Friendly Spaces program |
| 1 million | number of women and children affected |
| 70,000 | number of mothers who were expected to deliver in the first quarter of 2014 |
| 45,000 | number of children who were born out of proper facilities |
| 21% | percentage of communities with insufficient breast milk |
| 82% | percentage of health facilities damaged |
| 50% | percentage of health centers that are now functioning |
| 5.9 million | estimated number of workers who lost their sources of income and livelihood |
| 49% | percentage of workers in service sector |
| 13% | percentage of workers in industry sector |
| 38% | percentage of workers in the agriculture, forestry, and fishing sectors |
| 117,854 | number of people provided with immediate short-term employment and livelihood support and services |
| 80,000 | number of farmers who benefitted from seed distribution |
| 11,691 | number of fisherfolks who received assistance to restore damaged fishing boats |
| 44,000 | number of individuals in Region VIII who are endorsed for the mobile civil registration |
| 3,000 | number of individuals who have finished the process |
– Research by Fritzie Rodriguez and Jodesz Gavilan/Rappler.com
Add a comment
How does this make you feel?
There are no comments yet. Add your comment to start the conversation.