SUMMARY
This is AI generated summarization, which may have errors. For context, always refer to the full article.

Philippine senatorial races are interesting electoral phenomena. Senators are nationally elected, not locally elected. A senatorial candidate can be a member of one political party, but appearing in more than one ticket.
Each individual voter can combine senators on a ballot regardless of party, ticket, and slate. Voters can vote for no senators, or up to 12 senators. It’s a strange and interesting system when we examine how voters behave in the face of such complexity.
In a recently published article, we presented an analysis of the 2010 exit poll data collected by SWS to understand how voters combined senatorial candidates on their ballot. The dataset contained vote choices of over 50,000 randomly selected respondents. We could not use more recent data because they were either still under embargo, or did not have sample sizes this large. Since these data are from exit polls, they reflect actual vote choices after people cast their ballot, not voter preferences prior to elections.
The Celebrity, Incumbent, Dynasty Cluster
Cluster analysis of votes showed 4 distinct sets of candidates (Figure 1). The first set has 8 names; all are incumbents, dynasts, or members of political dynasties. Voters that select media celebrities are also more likely to vote for members of political dynasties and incumbents
The second set has 11 names, picked by many voters, it is almost a straight Liberal Party slate. These two first clusters contained all winning candidates in the election; the remaining two clusters are the less popular candidates. Many of the candidates in the third cluster are local representatives or government officials with limited national presence. In the last cluster are the remaining people who ran for Senate, they are not closely clustered together like the first two sets.
The clustering of the LP slate suggests that less-known candidates can benefit from being part of a slate packaged with a widely popular presidential candidate, eventual victor Benigno Aquino III. However, membership in the ticket alone would not be enough to bring a candidate to victory. In 2010 many voters picked a straight (or almost-straight) Liberal Party slate.
Figure 1. Clustering of Senatorial candidates, 2010

Wealth status, education level, and senatorial fill-up rate associated with senatorial preferences
After the cluster analysis, we examined the types of voters who are more likely to pick each set of candidates. While there are many possible factors that might matter, we were limited to testing only those that were measured in the exit poll of that year.
Voters who picked celebrities, incumbents, and dynasts are more likely to live in rural areas, be poorer, and report lower educational attainment. This is not particularly surprising. More interesting is the finding that those who picked this set of candidates overall tended to vote for fewer senatorial candidates (i.e. low fill-up rate). These factors taken together suggest that the problem is a lack of information in harder-to-reach and poorer areas or groups of voters about lesser-known senatorial candidates.
Those who went for close to a straight LP ticket tended to be wealthier, have higher educational attainment, and were more likely to fill their ballot.
Chart 1.
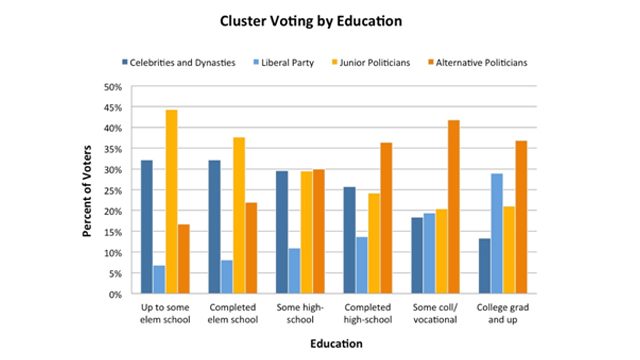
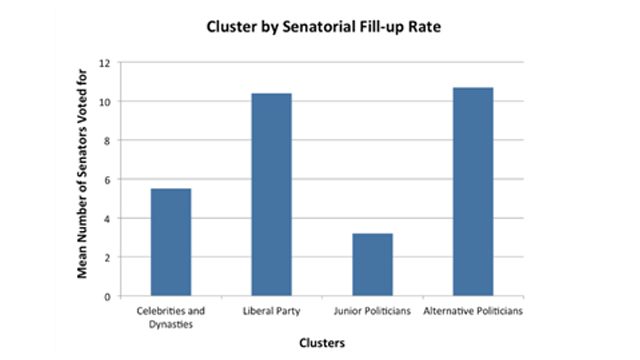
Chart 2.
High abstention rates
Professional pollsters have found, and we also see this in this data, that wealthier and higher education individuals are more likely to fill their senatorial ballots. They vote for more candidates.
Voters with more abstentions, those who picked fewer candidates, are more likely to have selected the celebrities, incumbents, and dynasts. We argue that these are the voters that rely largely on name recognition and probably have less access to information about the other candidates.
The majority of voters have a lot of “space” on their ballots. In each senatorial election, the average number of candidates people vote for is between 7 and 8. Each blank for a senatorial vote on a ballot is an abstention. These are very high rates of abstention for national-level offices, and are open opportunities for less popular candidates to gain votes.
These are admittedly, old data. We are limited by the availability of publicly available exit poll data that have large sample sizes such as the one conducted in 2010. Academic research in voter behavior using survey data often lag far behind real-world events, but what we can learn from these studies remain useful for our overall understanding of how Filipinos vote. – Rappler.com
Notes: Data were collected by the Social Weather Station, Inc. and are publicly available through their library. This study was published in the International Journal of Public Opinion Research, full-text of the article is available for download at http://ijpor.oxfordjournals.org/.
Clarissa C. David is a Professor at the UP College of Mass Communication and a fellow of Social Weather Stations Inc. She is also the 2015 Outstanding Young Scientist awardee for social science. EF Legara is a Complex Systems Scientist with a PhD in Physics from the National Institute of Physics, University of the Philippines Diliman.
Add a comment
How does this make you feel?
There are no comments yet. Add your comment to start the conversation.