SUMMARY
This is AI generated summarization, which may have errors. For context, always refer to the full article.

 During his state visit to the Philippines last month, Pope Francis urged political leaders (and everyone) to shun corruption. The Pope observed that there is a “scandalous social inequality” in the Philippines.
One does not need the Pope to tell us this reality, since one can merely look at towering skyscrapers adorning the skyline in Metro Manila, and informal settlers that also thrive at the backdrop of these high-rise buildings to get a sense of inequality in the country.
As far as income inequality is concerned, data (see Table 1) from the Family Income and Expenditure Survey (FIES), a survey conducted by the Philippine Statistics Authority (PSA) every three years, shows that the poorest 20% Filipinos own only less than 5% of the country’s total income while in a perfectly equal society, the poorest 20%, the next 20% all the way to the richest 20% Filipinos, should own 20% of total national income. Moreover, this level of inequality has been unchanged as shown by various measures of inequality such as the Palma ratio and Gini coefficient.
Table 1. Selected Statistics on Income Inequality and (Per Capita) Income Distribution in the Philippines: 2003, 2006 and 2009
| Statistics | 2003 | 2006 | 2009 |
| Average Per Capita Income (in Nominal PHP) | |||
| Poorest 20 Percent | 7,015 | 9,494 | 14,022 |
| Lower Middle 20 Percent | 12,461 | 16,747 | 24,396 |
| Middle 20 Percent | 19,476 | 26,404 | 37,606 |
| Upper Middle 20 Percent | 32,014 | 44,247 | 62,129 |
| Richest 20 Percent | 85,891 | 127,926 | 176,863 |
| TOTAL | 31,369 | 44,963 | 62,997 |
| Share of Bottom 20 Percent in National Income | 4.48% | 4.22% | 4.45% |
| Palma ratio (i.e., income of the top 10% to bottom 40%) | 3.09 | 3.47 | 3.27 |
| Gini | 0.495 | 0.516 | 0.506 |
Note: Author’s calculations from FIES 2003, 2006 and 2009.
Socio-economic inequality is a growing concern not just in the Philippines, but across the world.
The Gini coefficient for income/expenditure of selected ASEAN countries is listed in Table 2. When this table is seen together with the performance of these countries in reducing poverty in the last few years, it can be observed that generally, countries that have made significant improvement in reducing poverty among ASEAN economies are those with low levels of inequality, or with reduced inequality.
Table 2. Gini Coefficient across Selected ASEAN Countries: 1990, 2000, and Latest Year
| Country | 1990 | 2000 | Latest | Country | 1990 | 2000 | Latest |
| Cambodia | 0.383(1994) | 0.419 (2004) | 0.36 (2009) | Philippines | 0.438(1991) | 0.461 | 0.43 (2009) |
| Indonesia | 0.292 | 0.29 (1999) | 0.381 (2011) | Thailand | 0.453 | 0.428 | 0.394 (2010) |
| Malaysia | 0.477(1992) | 0.379 (2004) | 0.462 (2009) | Vietnam | 0.357(1993) | 0.376 (2002) | 0.356 (2008) |
Source: 2014 World Development Indicators
Inequality may threaten social cohesion and heighten tensions since it portrays inequitable distribution of economic opportunities. Some argue, however, that (income) inequality should not be immediately portrayed as a problem. As an economy expands, entrepreneurs with better command over assets and capital would be in a better position to benefit from economic growth.
As these people’s incomes grow faster than the income of the rest, the process creates inequality. But, the benefits from income growth could trickle down if the additional incomes are used as investments to create more jobs for the poor.
In a previous article, it was pointed out that we do not have clear evidence to suggest a reduction in poverty because instruments used in the two household surveys of the PSA used to generate estimates of poverty in the first half of 2012 and in the first semester of 2013 are not comparable. Poverty data from the 2006 to the 2012 FIES suggest that poverty rates have been unchanged since minute differences in the estimates are within margins of error.
It may seem puzzling why despite the growth in the gross domestic product (GDP) per capita (at an annual rate of 3.3% over the past decade), the income poverty rates and inequality measures in the country have been unchanged. A key element to understand this puzzle is income mobility.
Income mobility in the Philippines?
Income mobility describes the ability of people to partake in socio-economic opportunities created by economic growth.
In a policy note and a discussion paper released at the Philippine Institute for Development Studies, we report on our independent work examining movements in the incomes and expenditures of households surveyed by the PSA during the period 2003 to 2009.
An estimated 75.15% of the population in 2003 was non-poor, and, of which 66.88% remained non-poor but 8.28% became poor in 2006.
In 2003, about a quarter (24.85%) of the population was poor, of which 16.95% remained poor but 7.90% became non-poor in 2006. Thus, between 2003 and 2006, poverty inflows were practically equal to outflows for the entire population. That is, the share of the population that was non-poor and that became poor (8.28%) was practically equal to the share of the population that was poor that became non-poor (7.90%).
Of an estimated 20.5 million poor persons in 2003, 6.5 million moved out of poverty, but 6.8 million moved into poverty.
| Poverty Status 2003 | Poverty Status 2006 | ||
| Non-poor | Poor | Total | |
| Non-poor | 66.88 | 8.28 | 75.15 |
| Poor | 7.90 | 16.95 | 24.85 |
| Total | 74.77 | 25.23 | 100.00 |
A recent study by Martinez et al. (2014) on the distribution of expenditures suggests that almost half of the households experienced mobility in their expenditures from 2003 to 2009. About half (51%) of households that started in extreme (expenditure) poverty in 2003 moved up the expenditure ladder, but 77% of households that started non-poor moved down the expenditure distribution.[1]
[1] ‘Is there income mobility in the Philippines?’ Journal article written by Martinez, Western, Haynes and Tomaszewski and published in Asian-Pacific Economic Literature.
Table 4. Expenditure Transition Matrix, 2003 – 2009
| 2003 | 2009 | |||||
| Extreme poverty | Moderate poverty | Low middle income | Middle income | Upper middle income | Rich | |
| Extreme poverty | 0.4942 | 0.3951 | 0.1045 | 0.0062 | 0.0000 | 0.0000 |
| Moderate poverty | 0.2185 | 0.4219 | 0.3341 | 0.0243 | 0.0007 | 0.0004 |
| Low middle income | 0.0423 | 0.1983 | 0.5660 | 0.1860 | 0.0074 | 0.0000 |
| Middle income | 0.0040 | 0.0231 | 0.2933 | 0.5776 | 0.0934 | 0.0085 |
| Upper middle income | 0.0000 | 0.0000 | 0.0487 | 0.5298 | 0.3644 | 0.0572 |
| Rich | 0.0000 | 0.0000 | 0.0221 | 0.2665 | 0.4836 | 0.2279 |
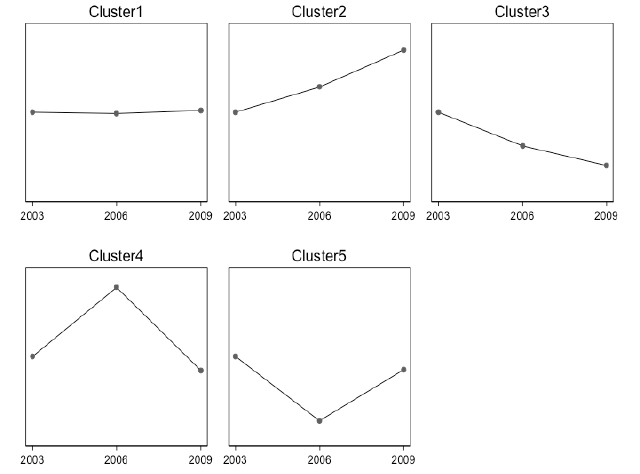
In general, Filipinos have experienced income and expenditure movements. Another paper about to be published by Martinez and his co-researchers found that approximately 11% of Filipino households experienced slow expenditure movements, 31% experienced consistently upward expenditure movements, 24% noted consistent downward expenditure movements, and 34% observed highly fluctuating expenditures.
All these studies conclude that there is volatility in the income and expenditure distribution, and that roughly the same number of households experienced upward and downward movements in income or expenditure.
Consequently, while there is significant income mobility in the Philippines, there is a strong offsetting force: for every household that experienced upward income mobility, there is approximately one household that experienced downward income mobility.
There is also a strong offsetting force over time because a significant fraction of Filipinos experienced income volatilities, with income growth being followed by income reductions (and vice-versa). Together, these factors contribute to the lack of changes in poverty rates and income inequality at the aggregate-level.
Figure 1. Different Types of Income Trajectories, 2003-2009
In summary, it is not the case that economic growth has not led the poor out of poverty.
Empirical data from comparable surveys suggest that economic growth has coincided with a significant fraction of the initially poor getting out of poverty.
However, this poverty reduction has been offset by the number of initially non-poor falling into poverty. To make economic growth truly inclusive, the government should not only be concerned with the poor, but also it must have policy instruments to assist those who are non-poor but plagued by economic risks.
Policymakers need to develop public policies on risk management such as adequate insurance and social protection coverage. While some social protection mechanisms such as the conditional cash transfer are promising to yield long term effects on income distribution, it will be important to monitor and evaluate the effectiveness of existing social protection infrastructure in the Philippines because if left unaddressed, income shocks may hamper the thrust for inclusive growth and for sustained prospects of the country’s development. – Rappler.com
Dr. Jose Ramon “Toots” Albert is a professional statistician who has written on poverty measurement, education statistics, agricultural statistics, climate change, macro-prudential monitoring, survey design, data mining, and statistical analysis of missing data. He is a Senior Research Fellow of the government’s think tank Philippine Institute for Development Studies, and the president of the country’s professional society of data producers, users and analysts, the Philippine Statistical Association, Inc. for 2014-2015. He also teaches at De La Salle University, Holy Angel University and at the Asian Institute of Management.
Arturo Martinez, Jr. is a Research Fellow at the Australian Research Council Centre of Excellence for Children and Families over the Life Course. He finished a bachelor’s and master’s degree in Statistics from the University of the Philippines Diliman and is currently a PhD in Applied Statistics student at the Institute for Social Science Research at the University of Queensland. He is also acting as one of the assistant chairs of the Social Statistics Section of the Statistical Society of Australia.
Add a comment
How does this make you feel?
There are no comments yet. Add your comment to start the conversation.