SUMMARY
This is AI generated summarization, which may have errors. For context, always refer to the full article.
![[ANALYSIS] How many cases of COVID-19 will there be in your area?](https://www.rappler.com/tachyon/r3-assets/612F469A6EA84F6BAE882D2B94A4B421/img/D65873229D574E2AB6B24476A5889C52/article-1-march-24-2020.jpg)
Editor’s note: A longer version of this article was first published on Medium on March 10, 2020. It is being reposted with the author’s permission. Watch and read the transcript of his interview with Rappler‘s Maria Ressa.
READ: Concluding Part | COVID-19: The difference in death rates

With everything that’s happening about the Coronavirus, it might be very hard to make a decision of what to do today. Should you wait for more information? Do something today? What?
When you’re done reading the article, this is what you’ll take away:
The coronavirus is coming to you.
It’s coming at an exponential speed: gradually, and then suddenly.
It’s a matter of days. Maybe a week or two.
When it does, your healthcare system will be overwhelmed.
Your fellow citizens will be treated in the hallways.
Exhausted healthcare workers will break down. Some will die.
They will have to decide which patient gets the oxygen and which one dies.
The only way to prevent this is social distancing today. Not tomorrow. Today.
That means keeping as many people home as possible, starting now.
As a politician, community leader or business leader, you have the power and the responsibility to prevent this.
You might have fears today: What if I overreact? Will people laugh at me? Will they be angry at me? Will I look stupid? Won’t it be better to wait for others to take steps first? Will I hurt the economy too much?
But in 2–4 weeks, when the entire world is in lockdown, when the few precious days of social distancing you will have enabled will have saved lives, people won’t criticize you anymore: They will thank you for making the right decision.
Ok, let’s do this.
Country growth
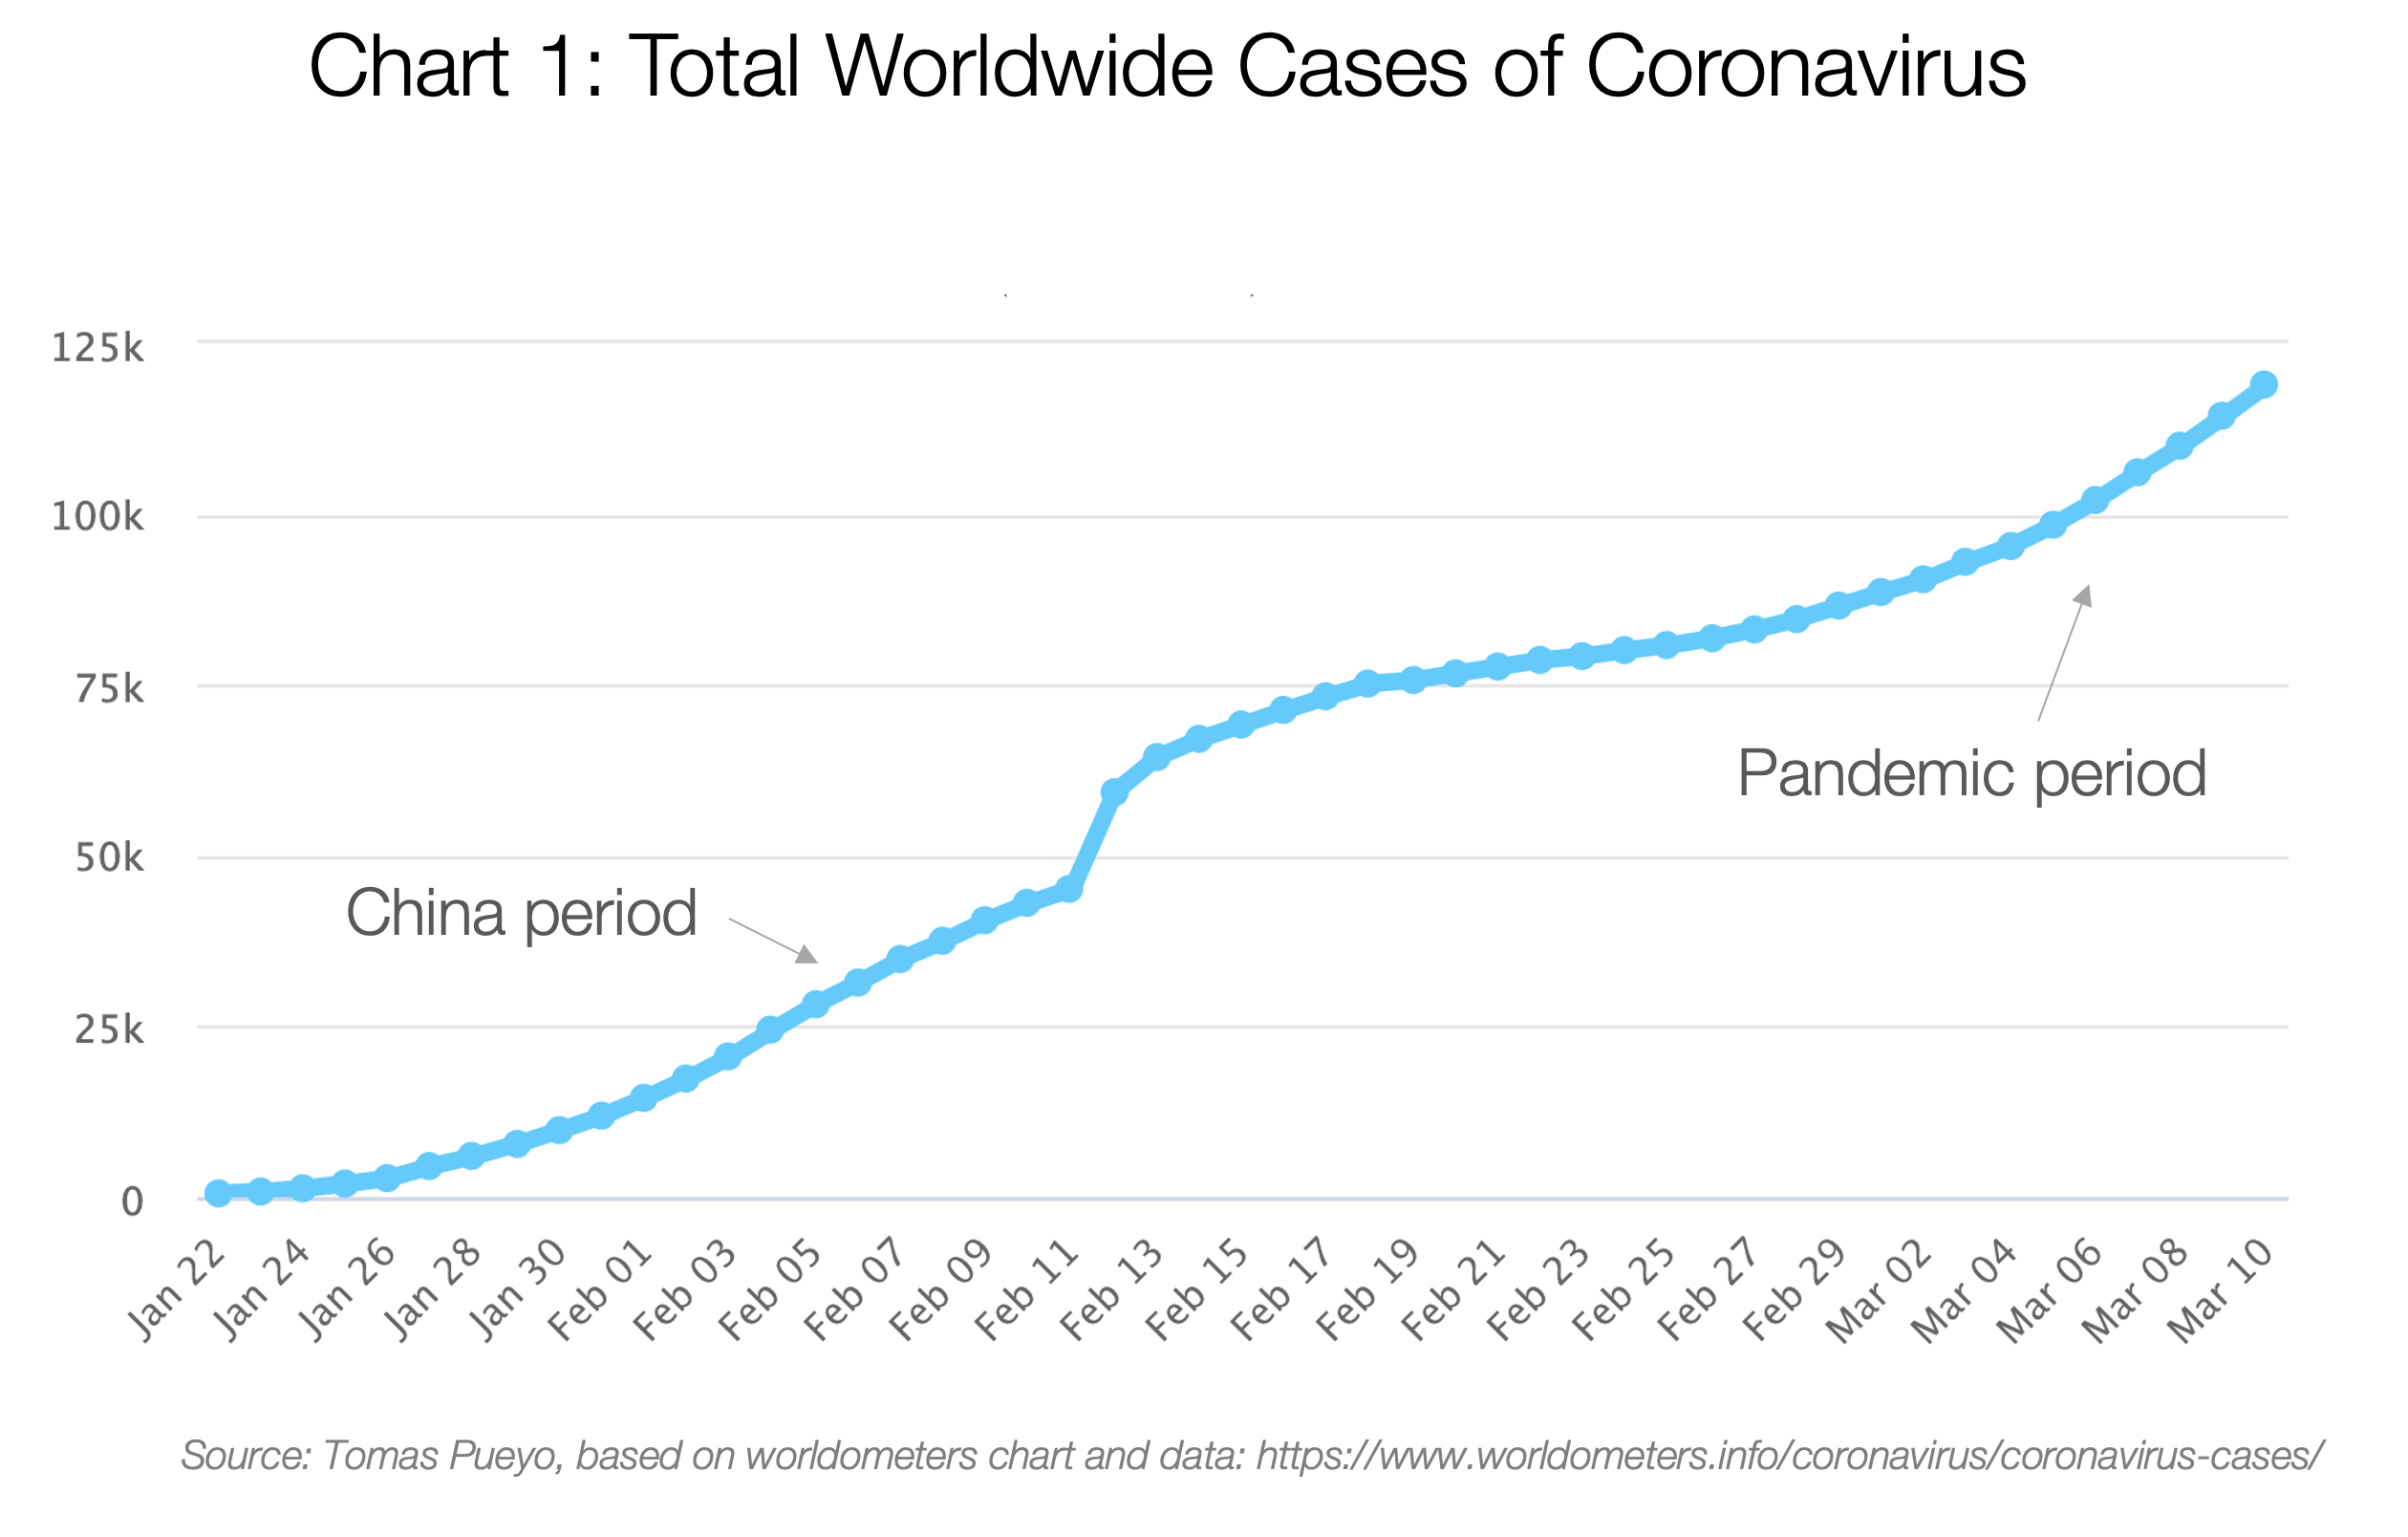
The total number of cases grew exponentially until China contained it. But then, it leaked outside, and now it’s a pandemic that nobody can stop.
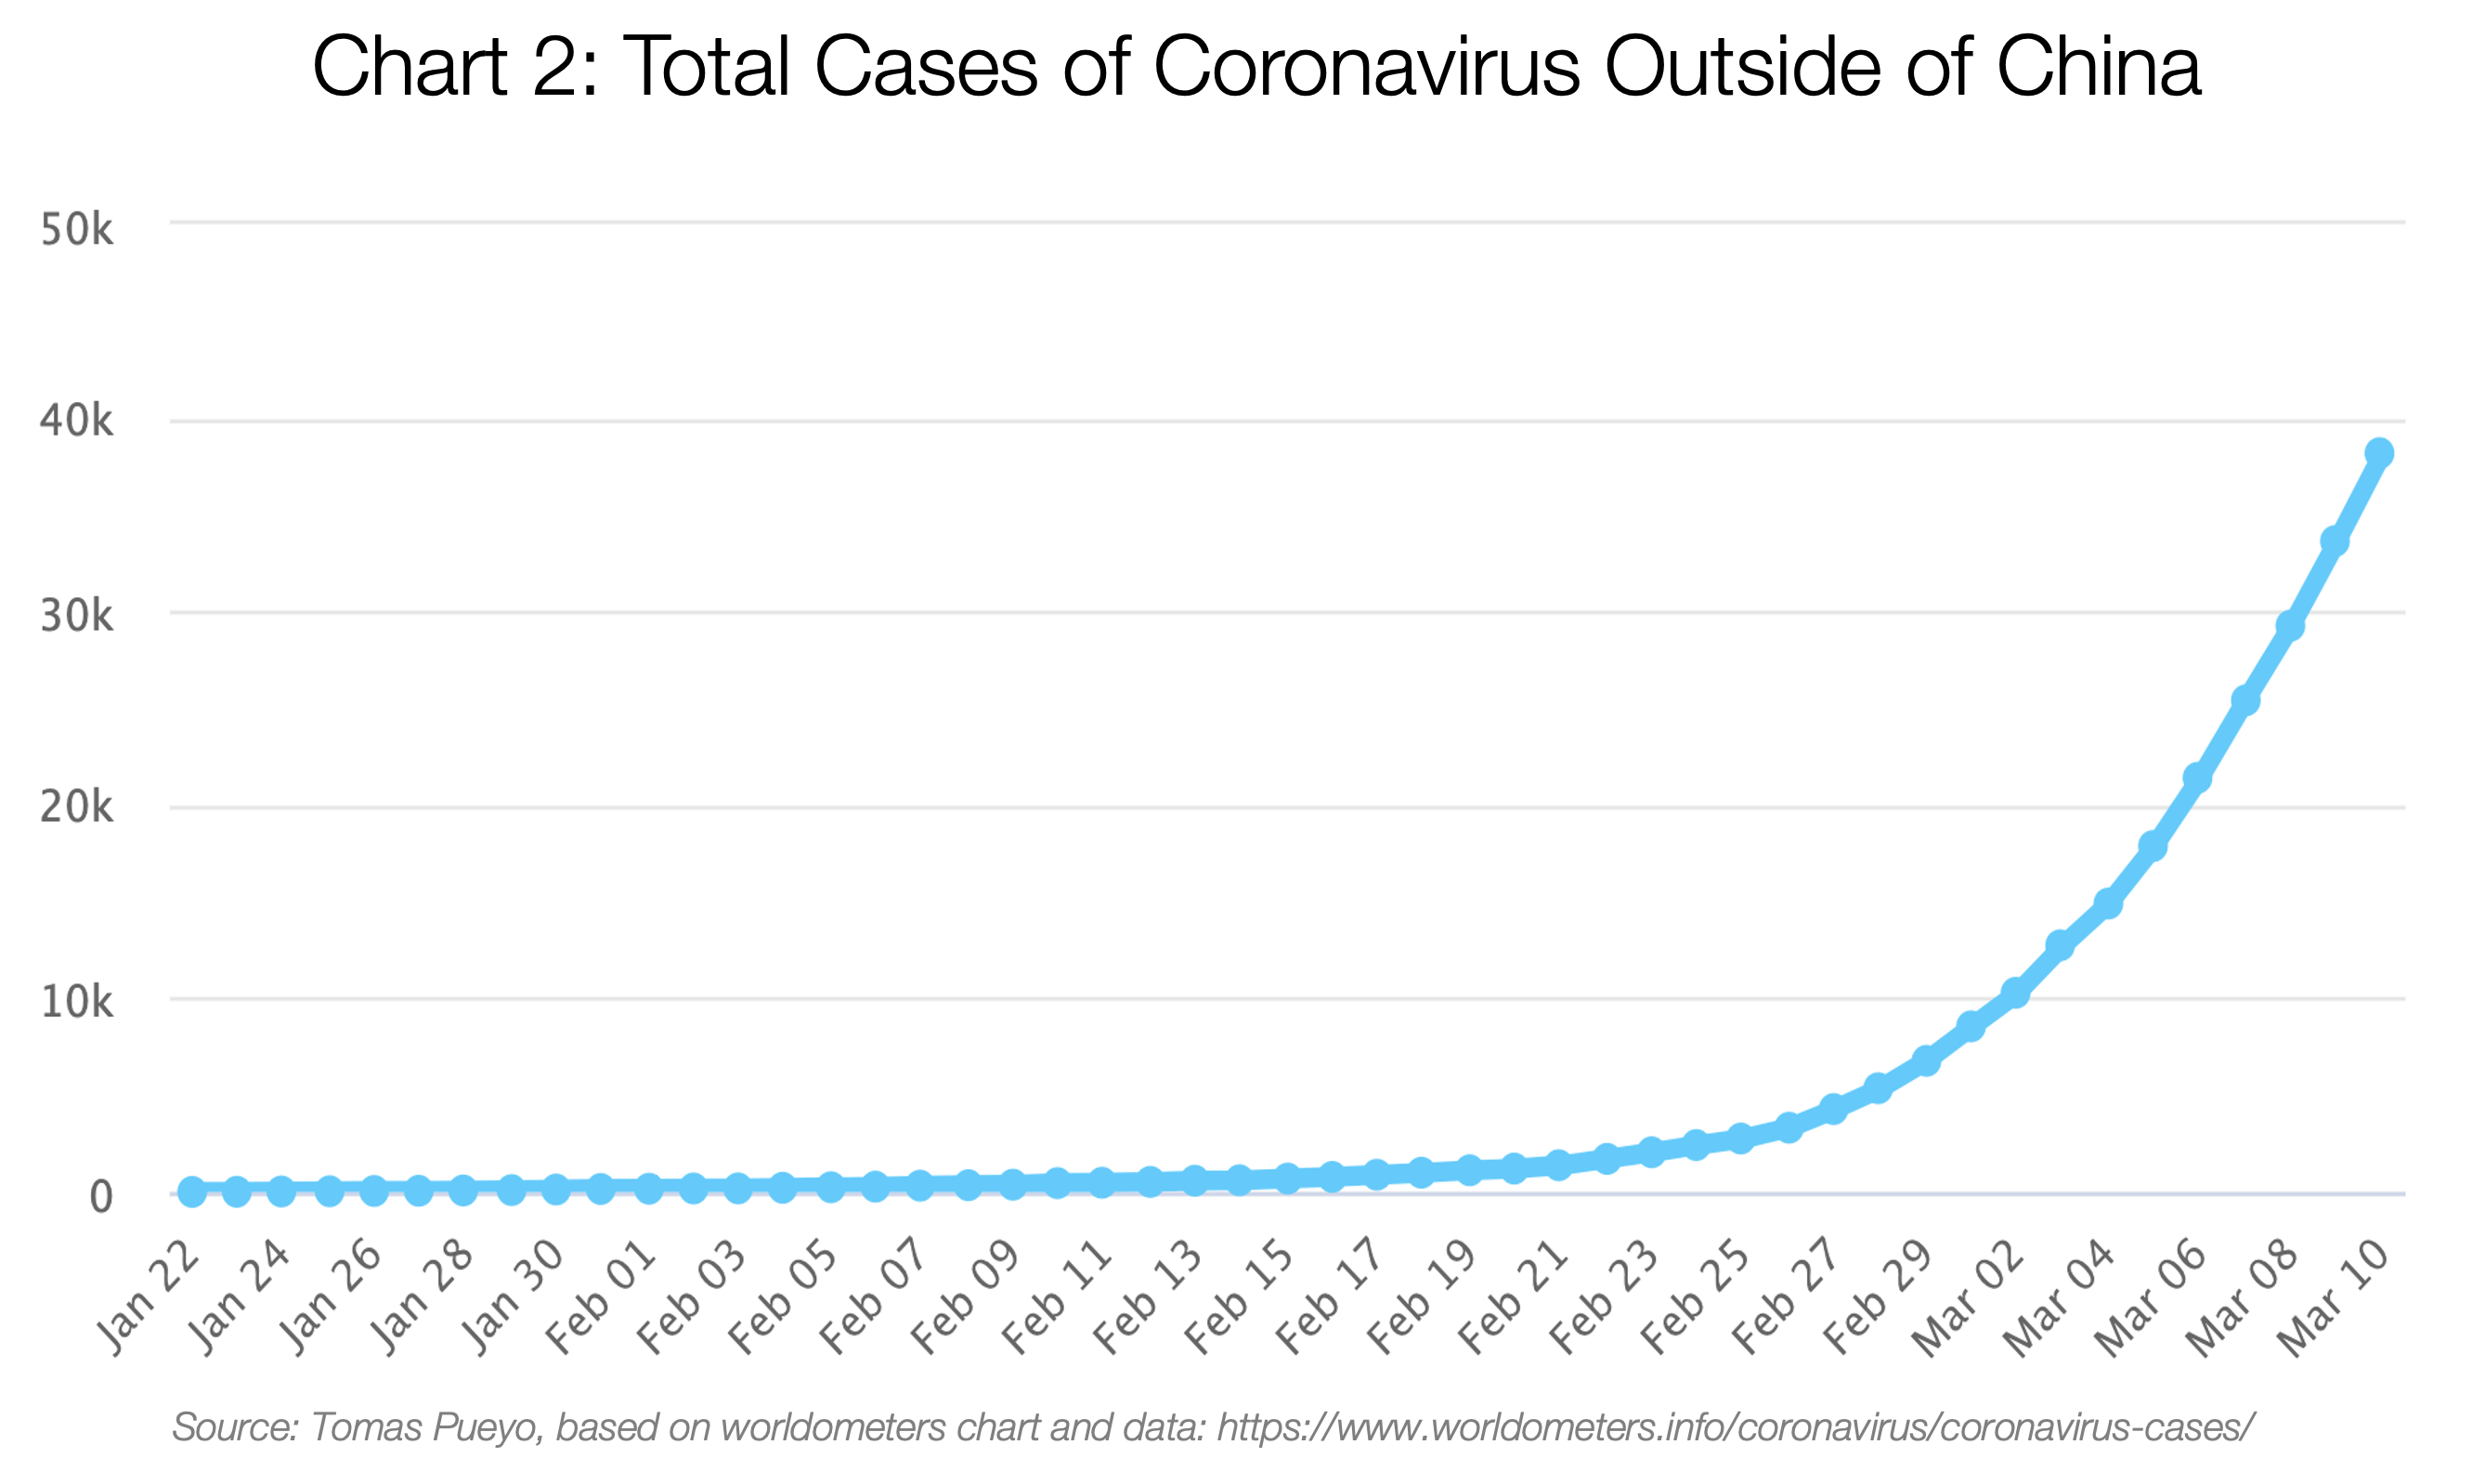
As March 10, this is mostly due to Italy, Iran and South Korea:
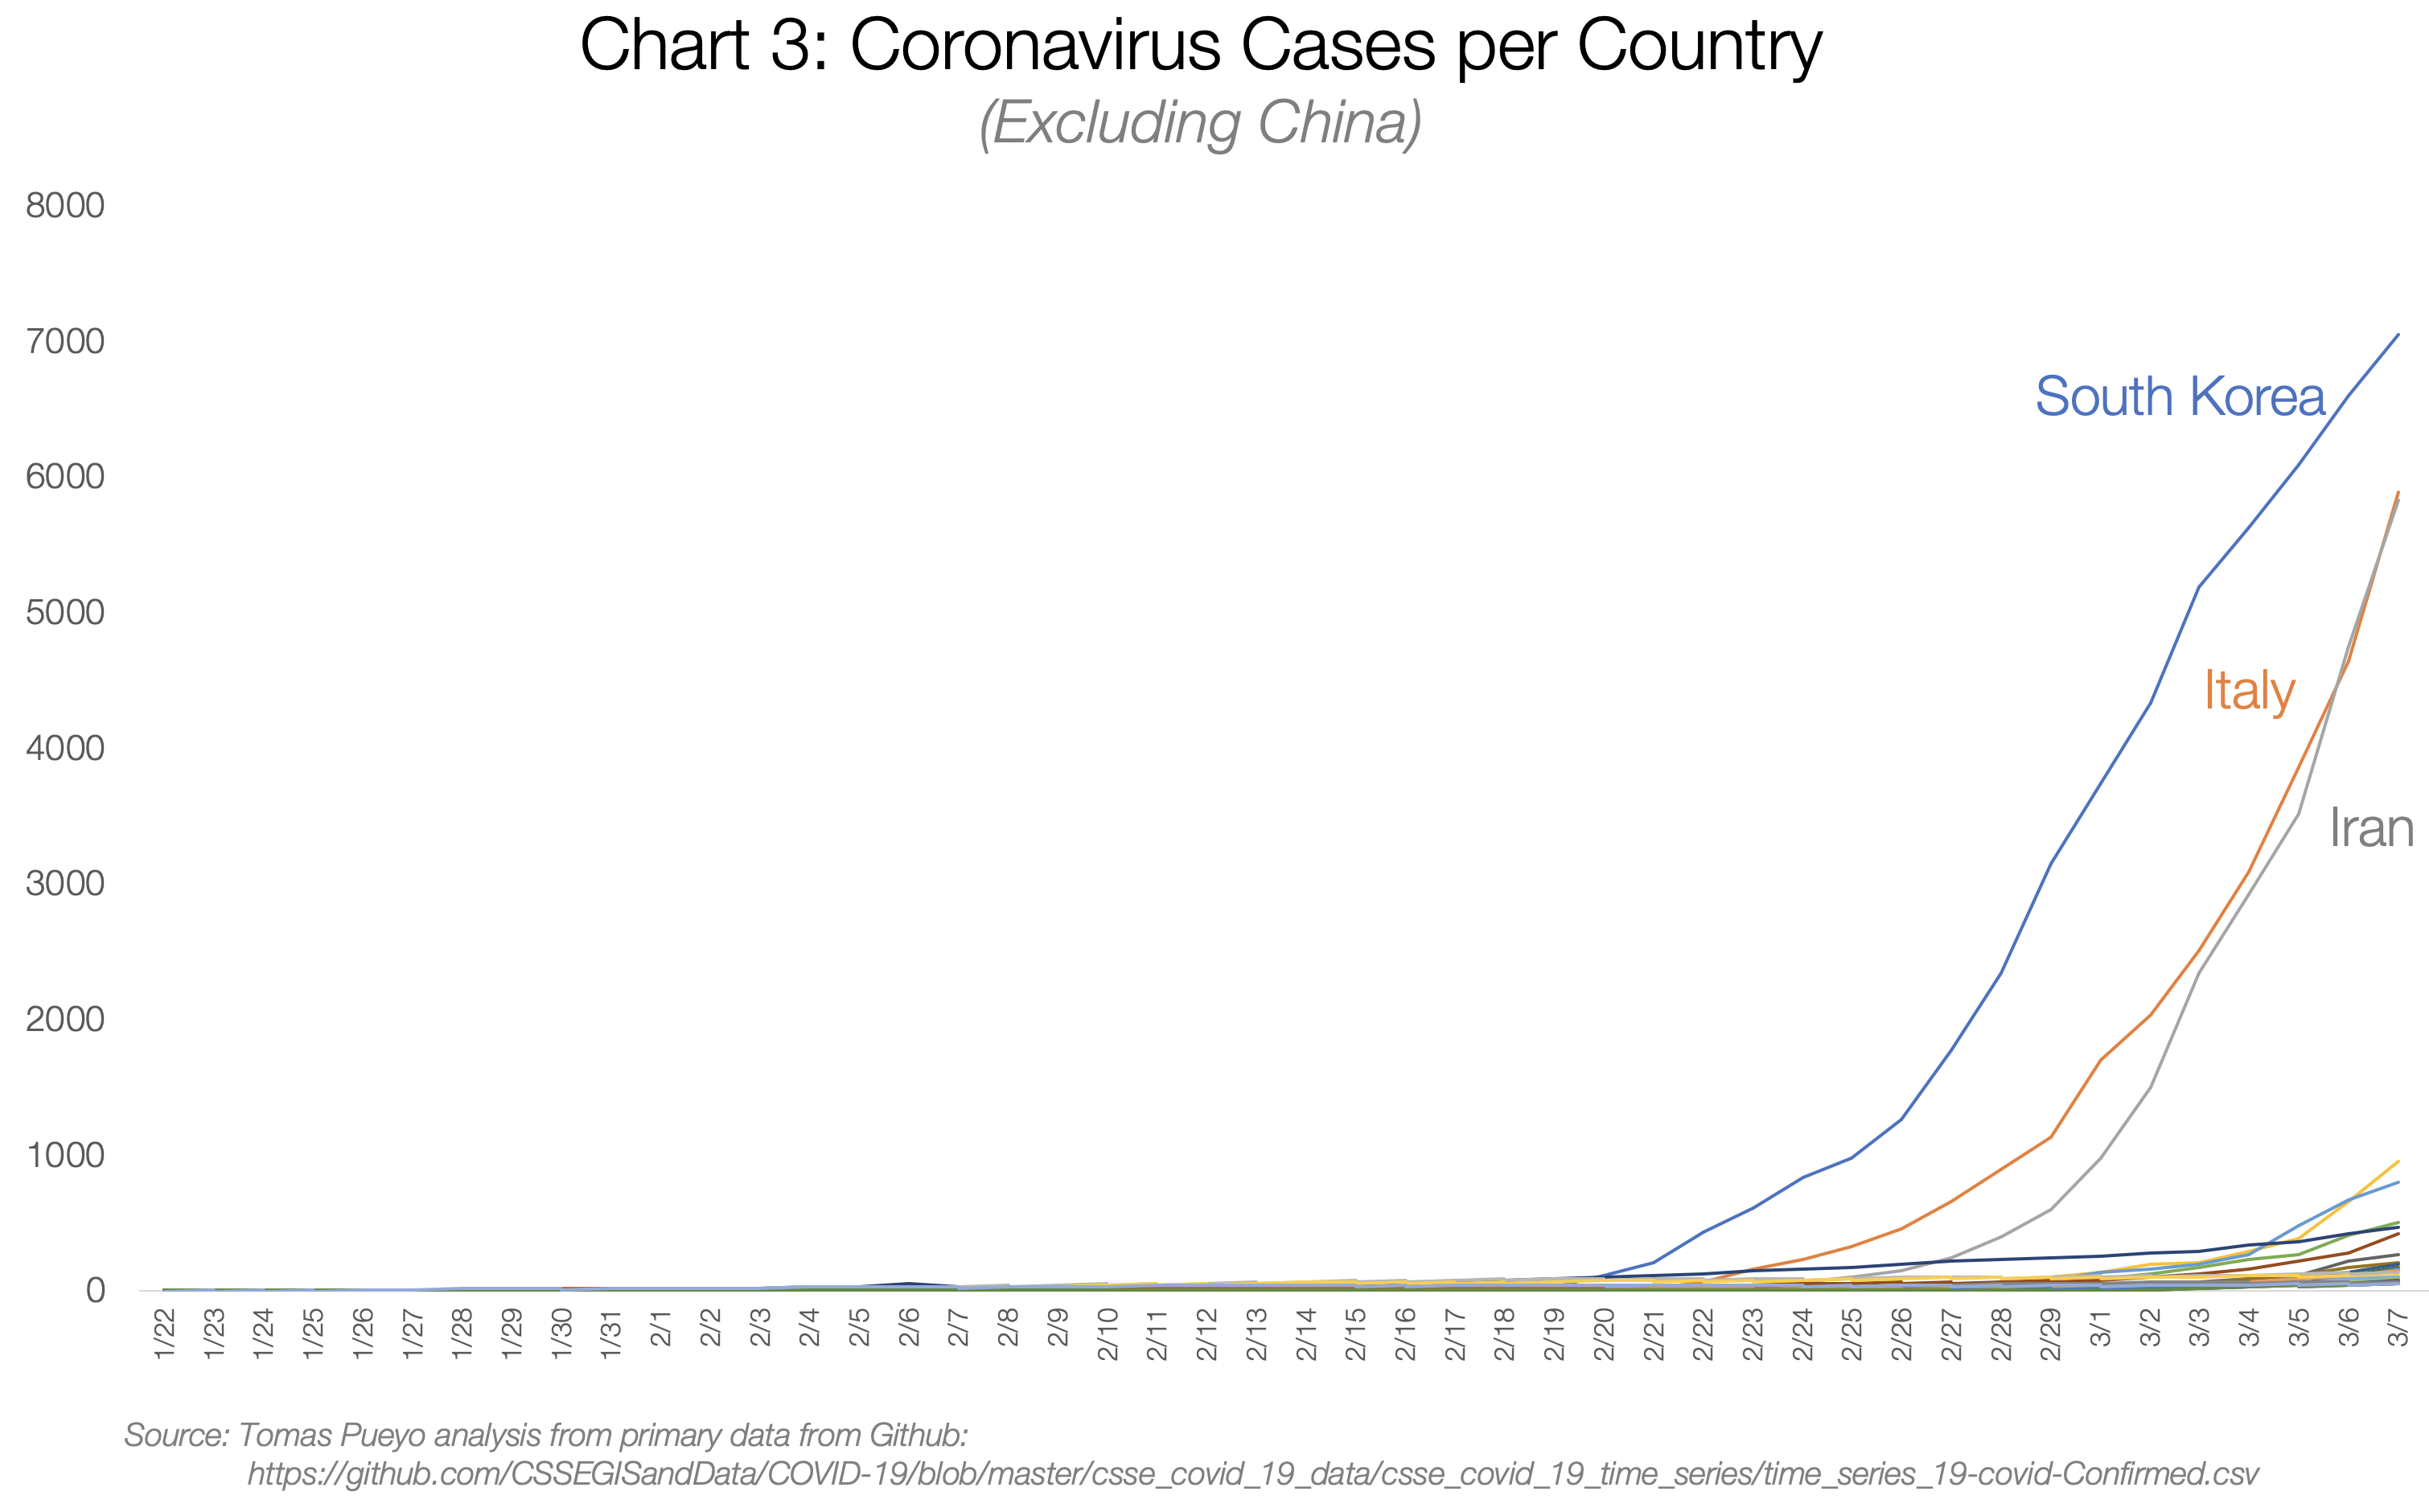
There are so many cases in South Korea, Italy, and Iran that it’s hard to see the rest of the countries, but let’s zoom in on that corner at the bottom right.
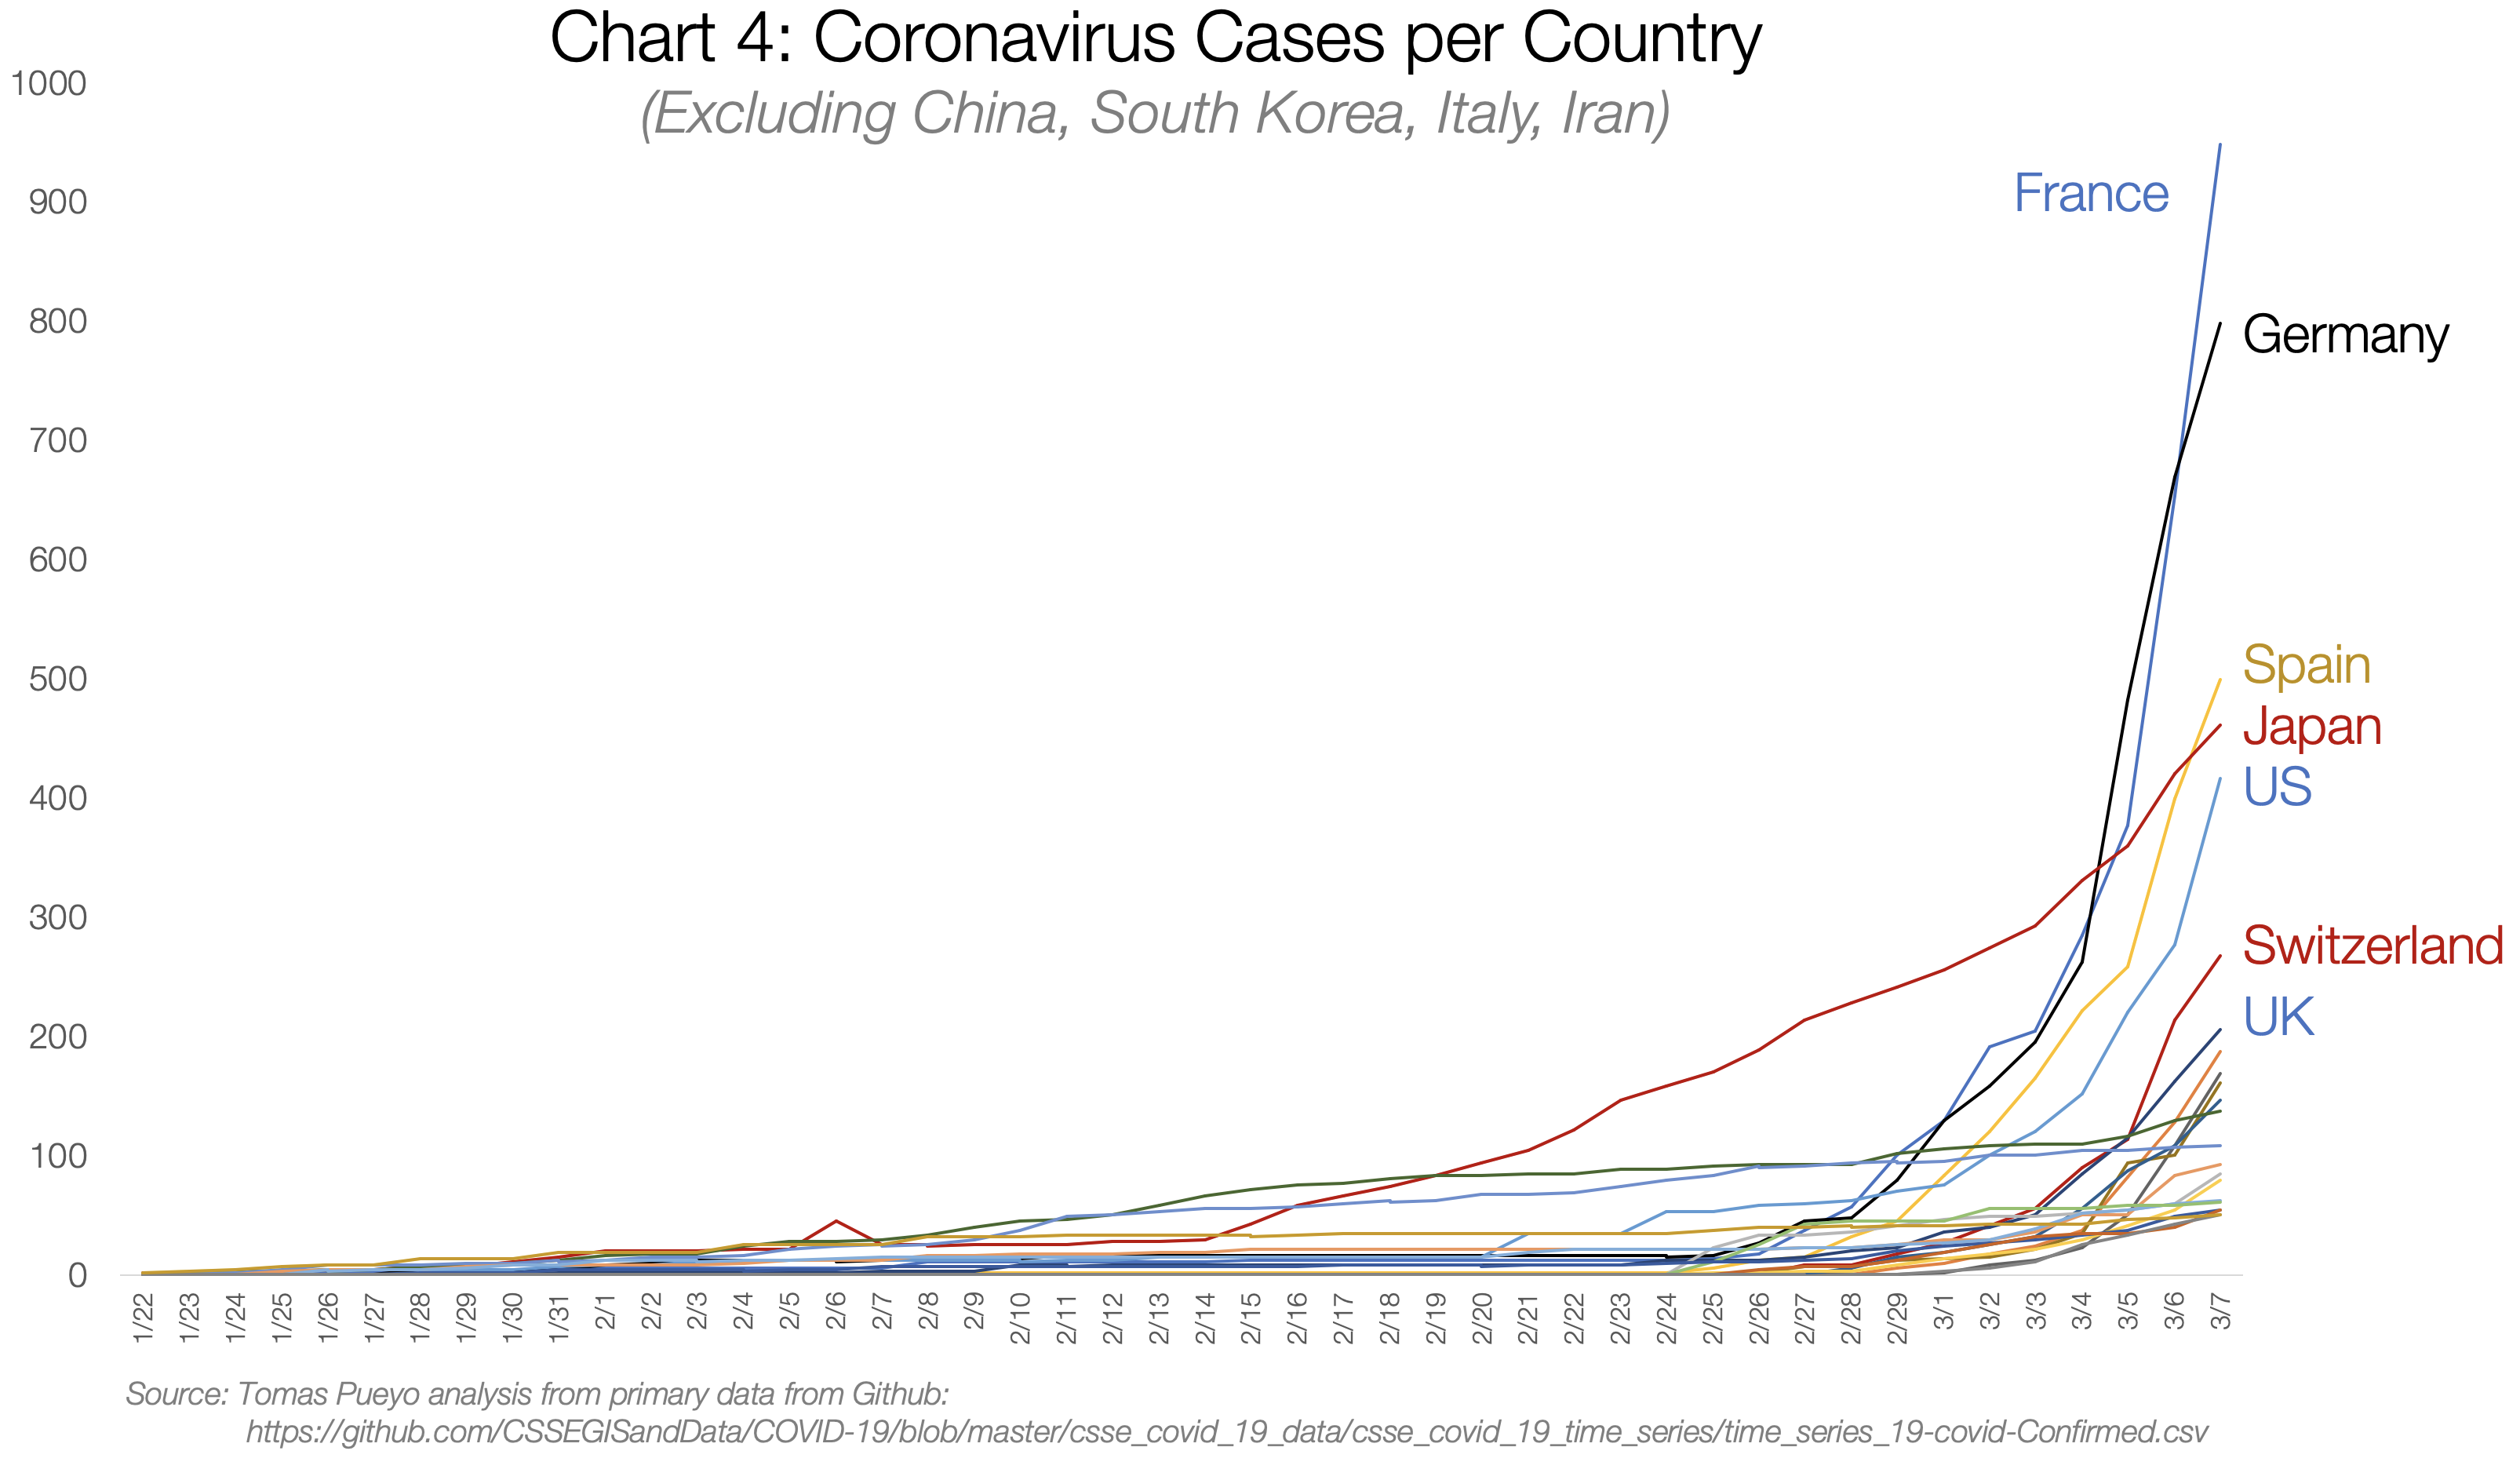
There are dozens of countries with exponential growth rates. As of today, most of them are Western.
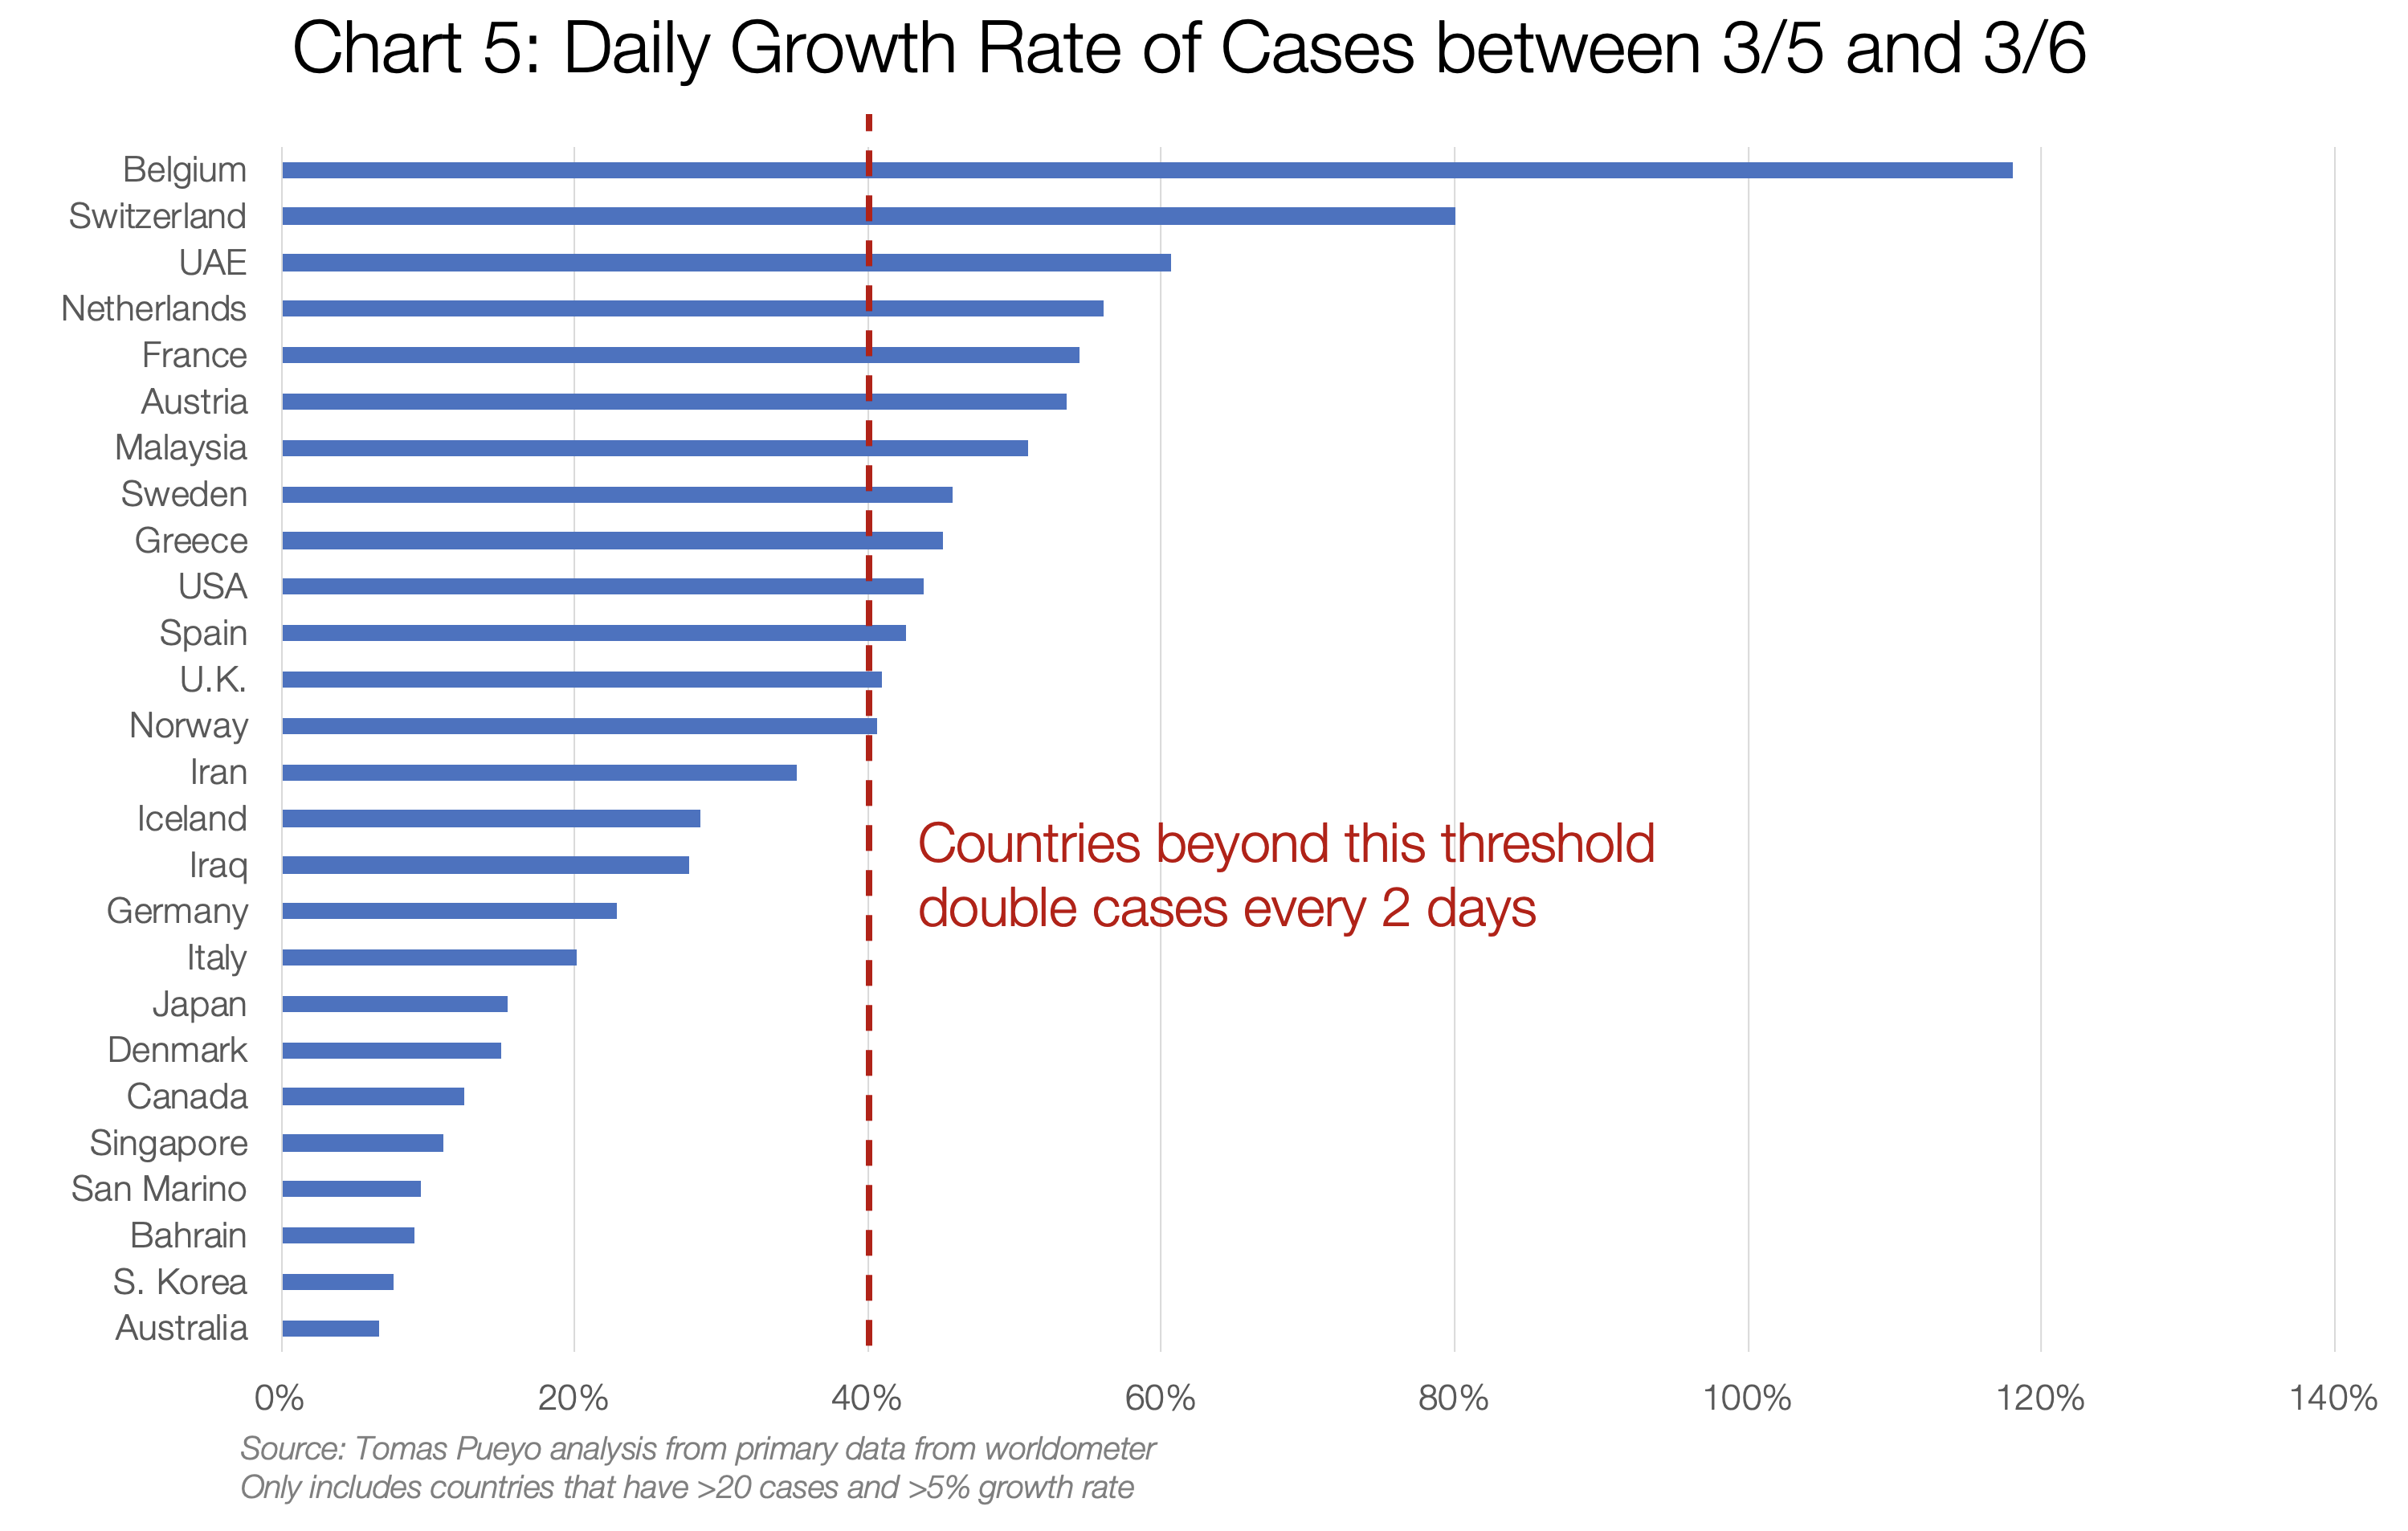
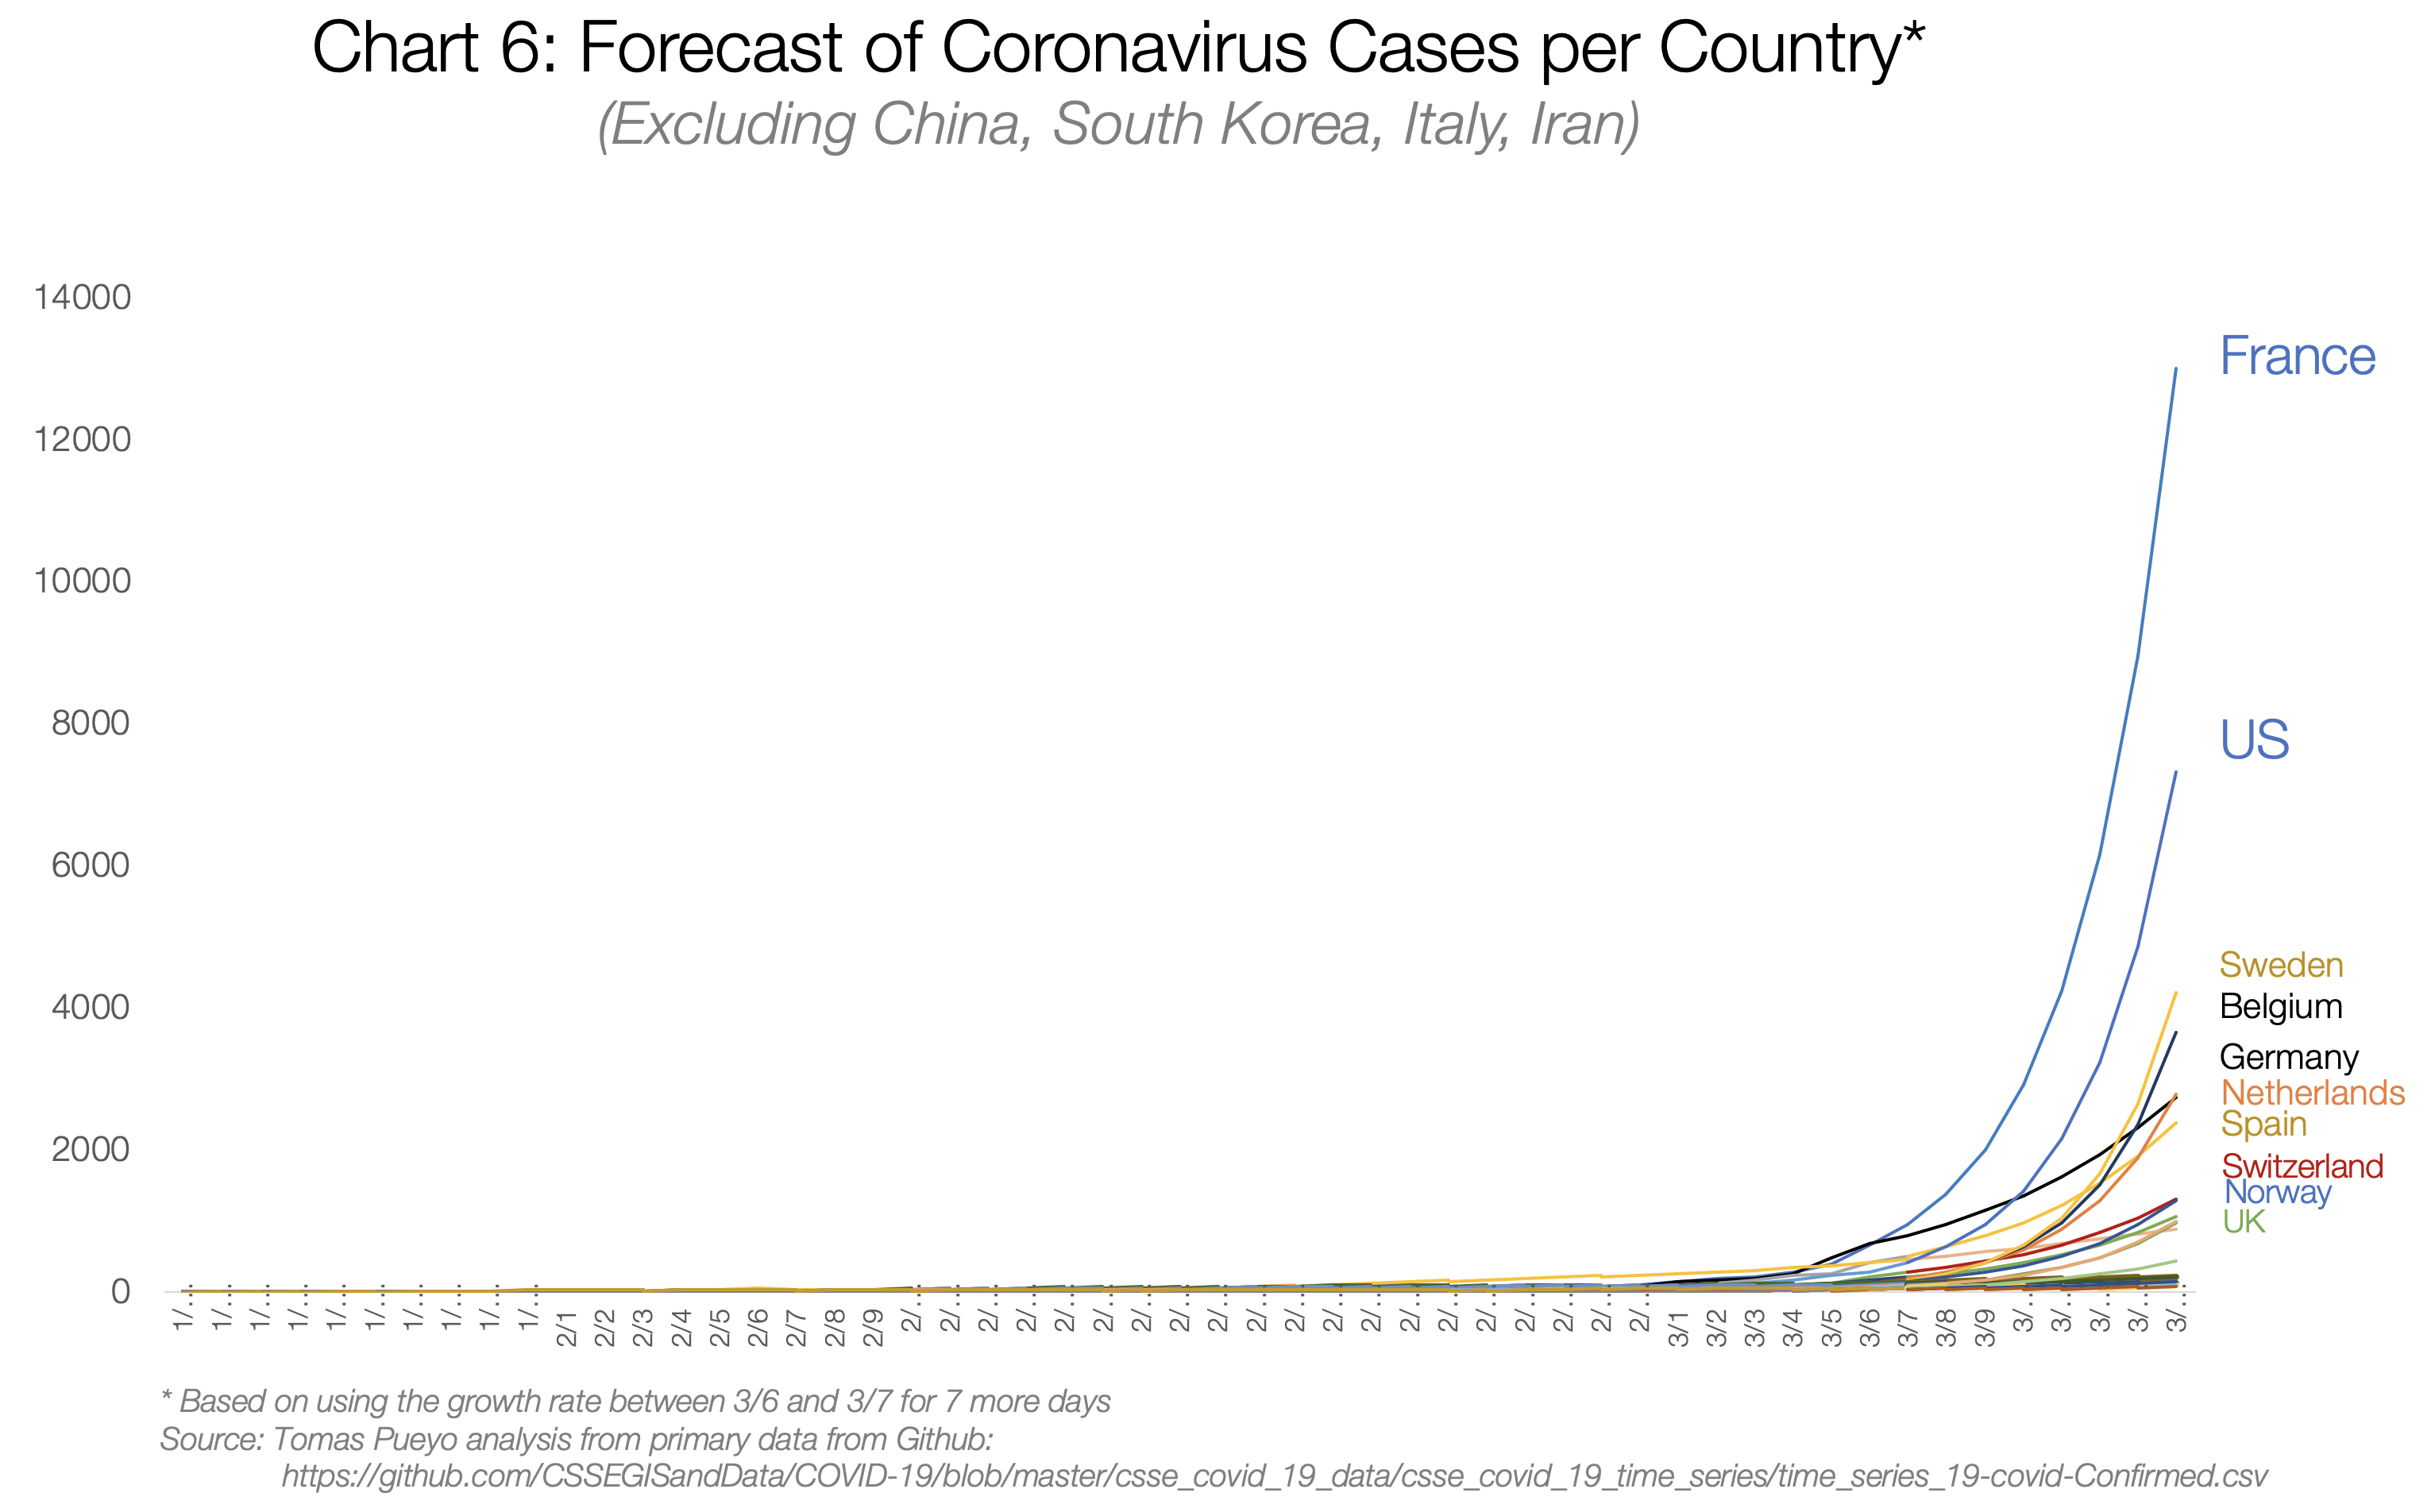
If you keep up with that type of growth rate for just a week, this is what you get:
If you want to understand what will happen, or how to prevent it, you need to look at the cases that have already gone through this: China, Eastern countries with SARS experience, and Italy.
China
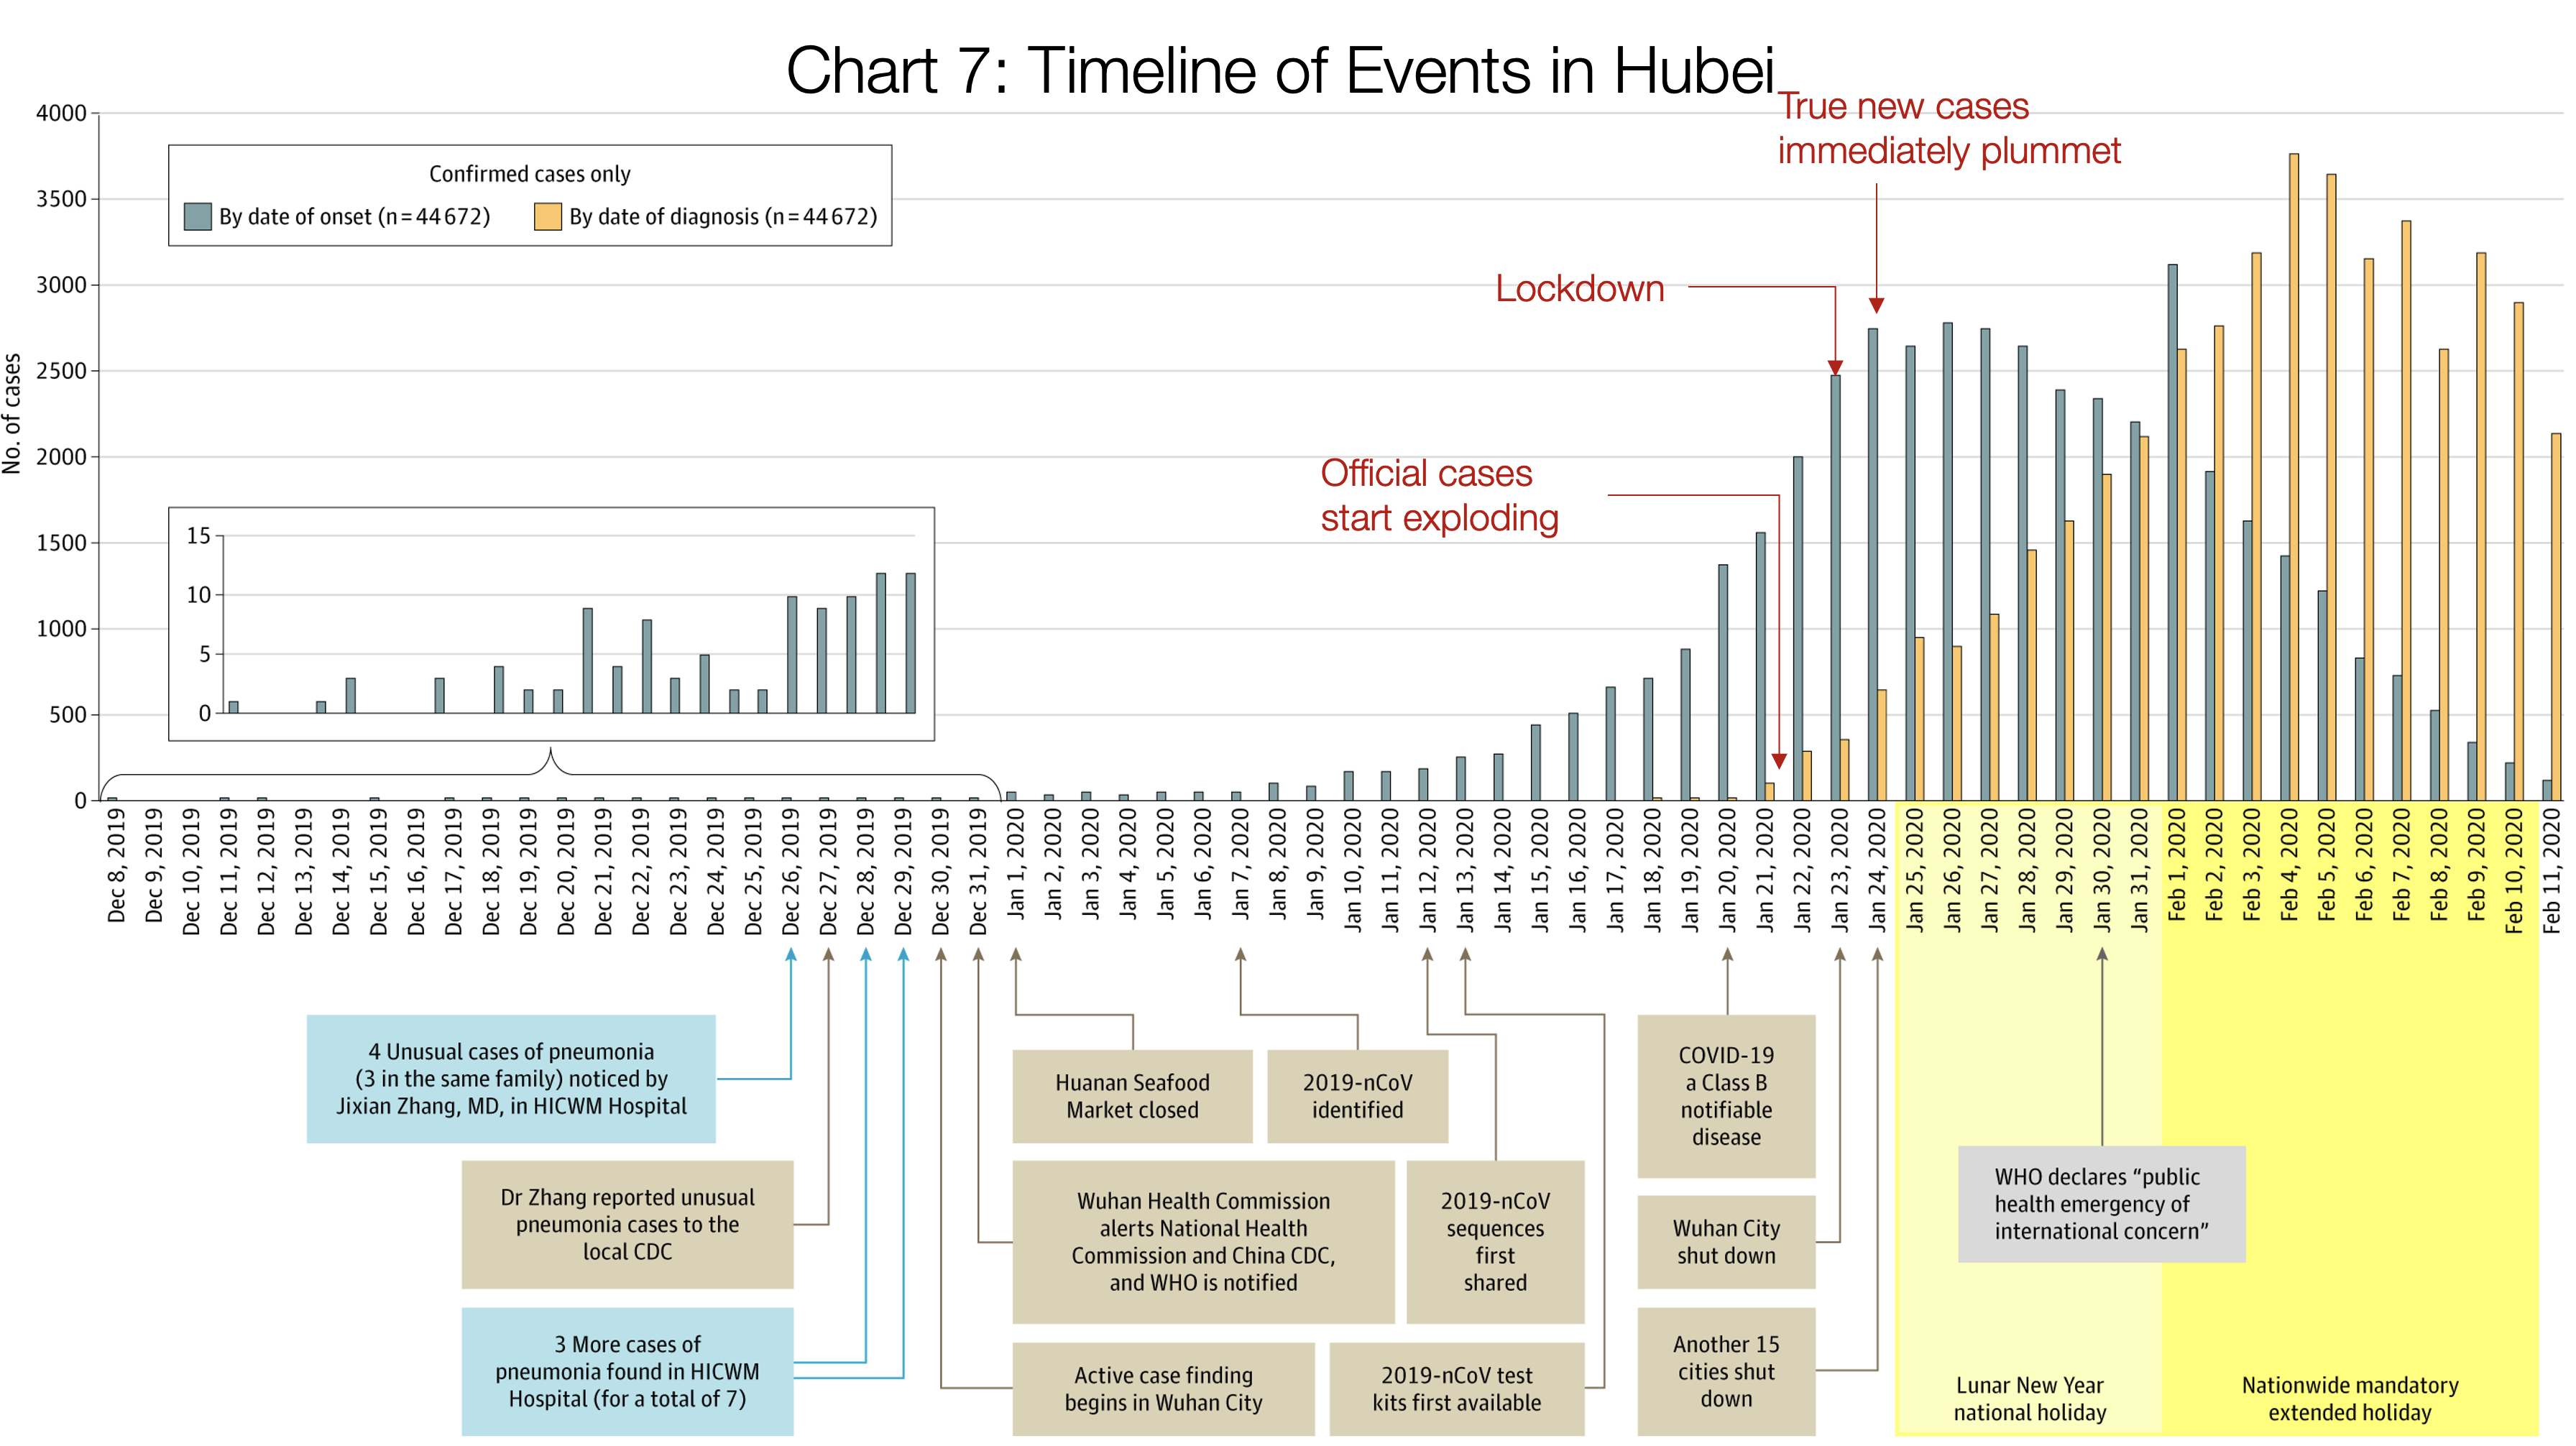
Source: Tomas Pueyo analysis over chart from the Journal of the American Medical Association, based on raw case data from the Chinese Center for Disease Control and Prevention
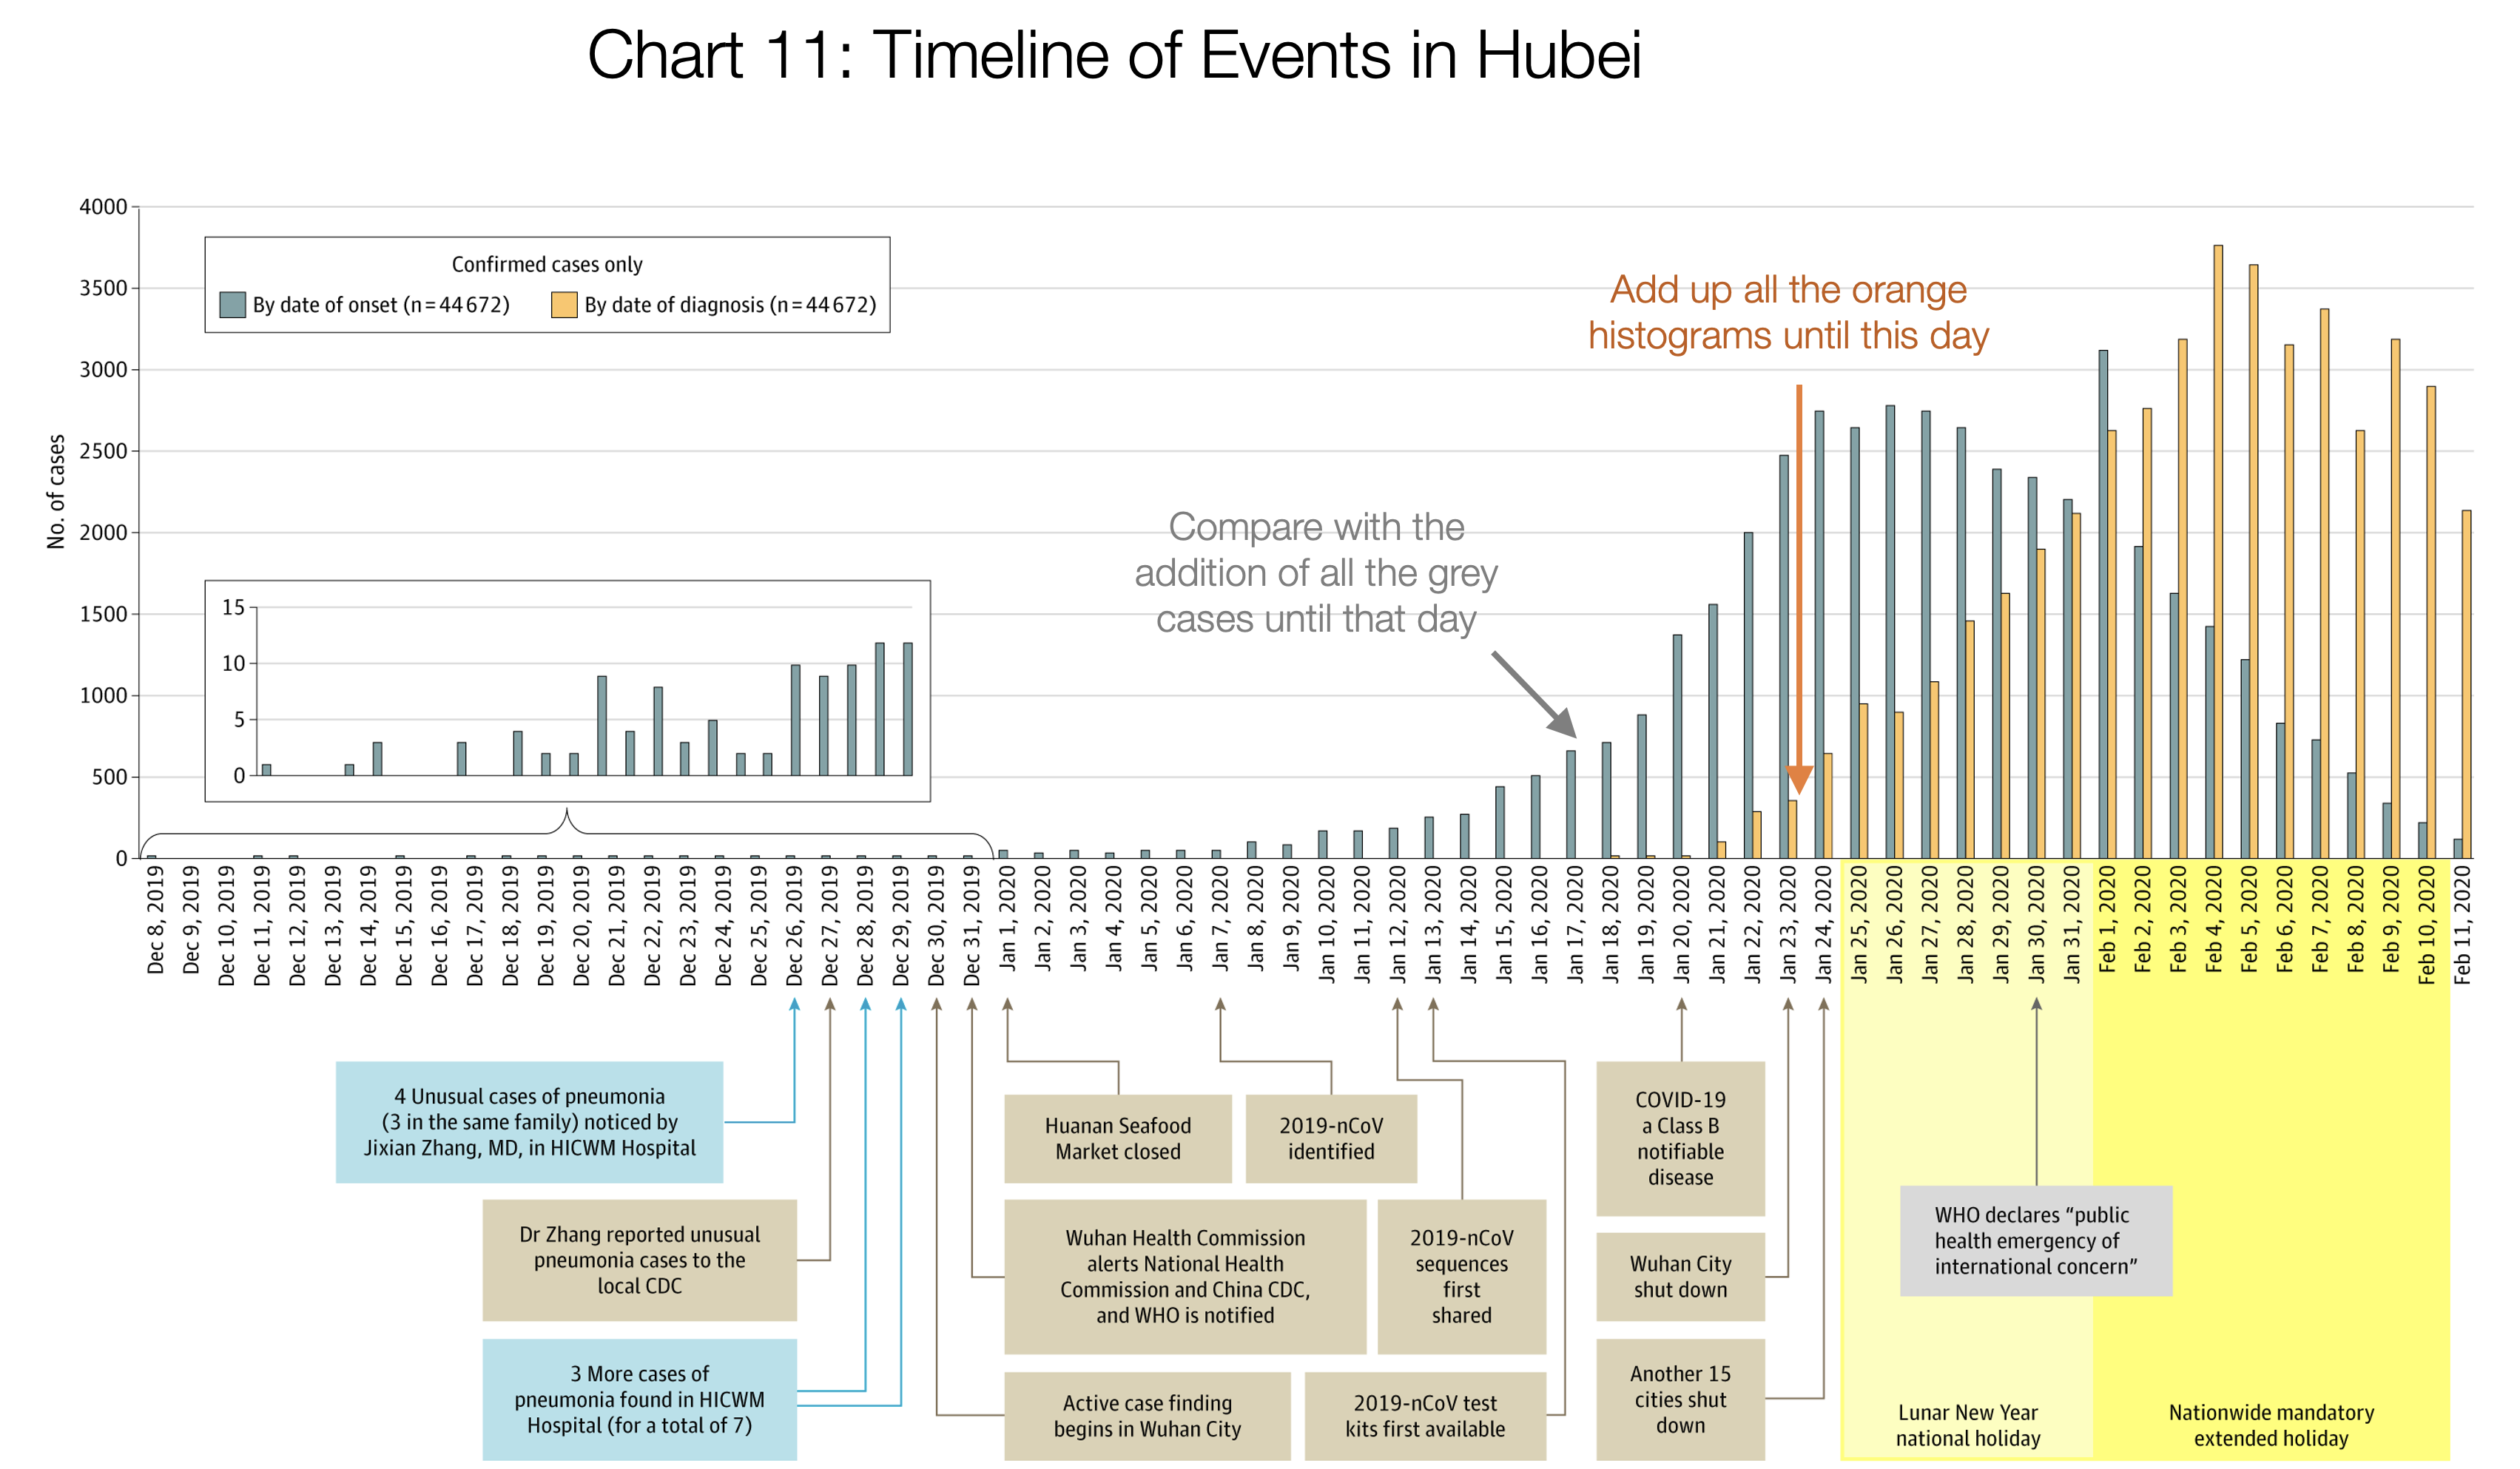
This is one of the most important charts.
It shows in orange bars the daily official number of cases in Hubei province: How many people were diagnosed that day.
The gray bars show the true daily coronavirus cases. The Chinese CDC found these by asking patients during the diagnostic when their symptoms started.
Crucially, these true cases weren’t known at the time. We can only figure them out looking backwards: The authorities don’t know that somebody just started having symptoms. They know when somebody goes to the doctor and gets diagnosed.
What this means is that the orange bars show you what authorities knew, and the gray ones what was really happening.
On January 21st, the number of new diagnosed cases (orange) is exploding: there are around 100 new cases. In reality, there were 1,500 new cases that day, growing exponentially. But the authorities didn’t know that. What they knew was that suddenly there were 100 new cases of this new illness.
Two days later, authorities shut down Wuhan. At that point, the number of diagnosed daily new cases was ~400. Note that number: they made a decision to close the city with just 400 new cases in a day. In reality, there were 2,500 new cases that day, but they didn’t know that.
The day after, another 15 cities in Hubei shut down.
Up until January 23rd, when Wuhan closes, you can look at the gray graph: it’s growing exponentially. True cases were exploding. As soon as Wuhan shuts down, cases slow down. On January 24th, when another 15 cities shut down, the number of true cases (again, gray) grinds to a halt. Two days later, the maximum number of true cases was reached, and it has gone down ever since.
Note that the orange (official) cases were still growing exponentially: For 12 more days, it looked like this thing was still exploding. But it wasn’t. It’s just that the cases were getting stronger symptoms and going to the doctor more, and the system to identify them was stronger.
This concept of official and true cases is important. Let’s keep it in mind for later.
The rest of regions in China were well coordinated by the central government, so they took immediate and drastic measures. This is the result:
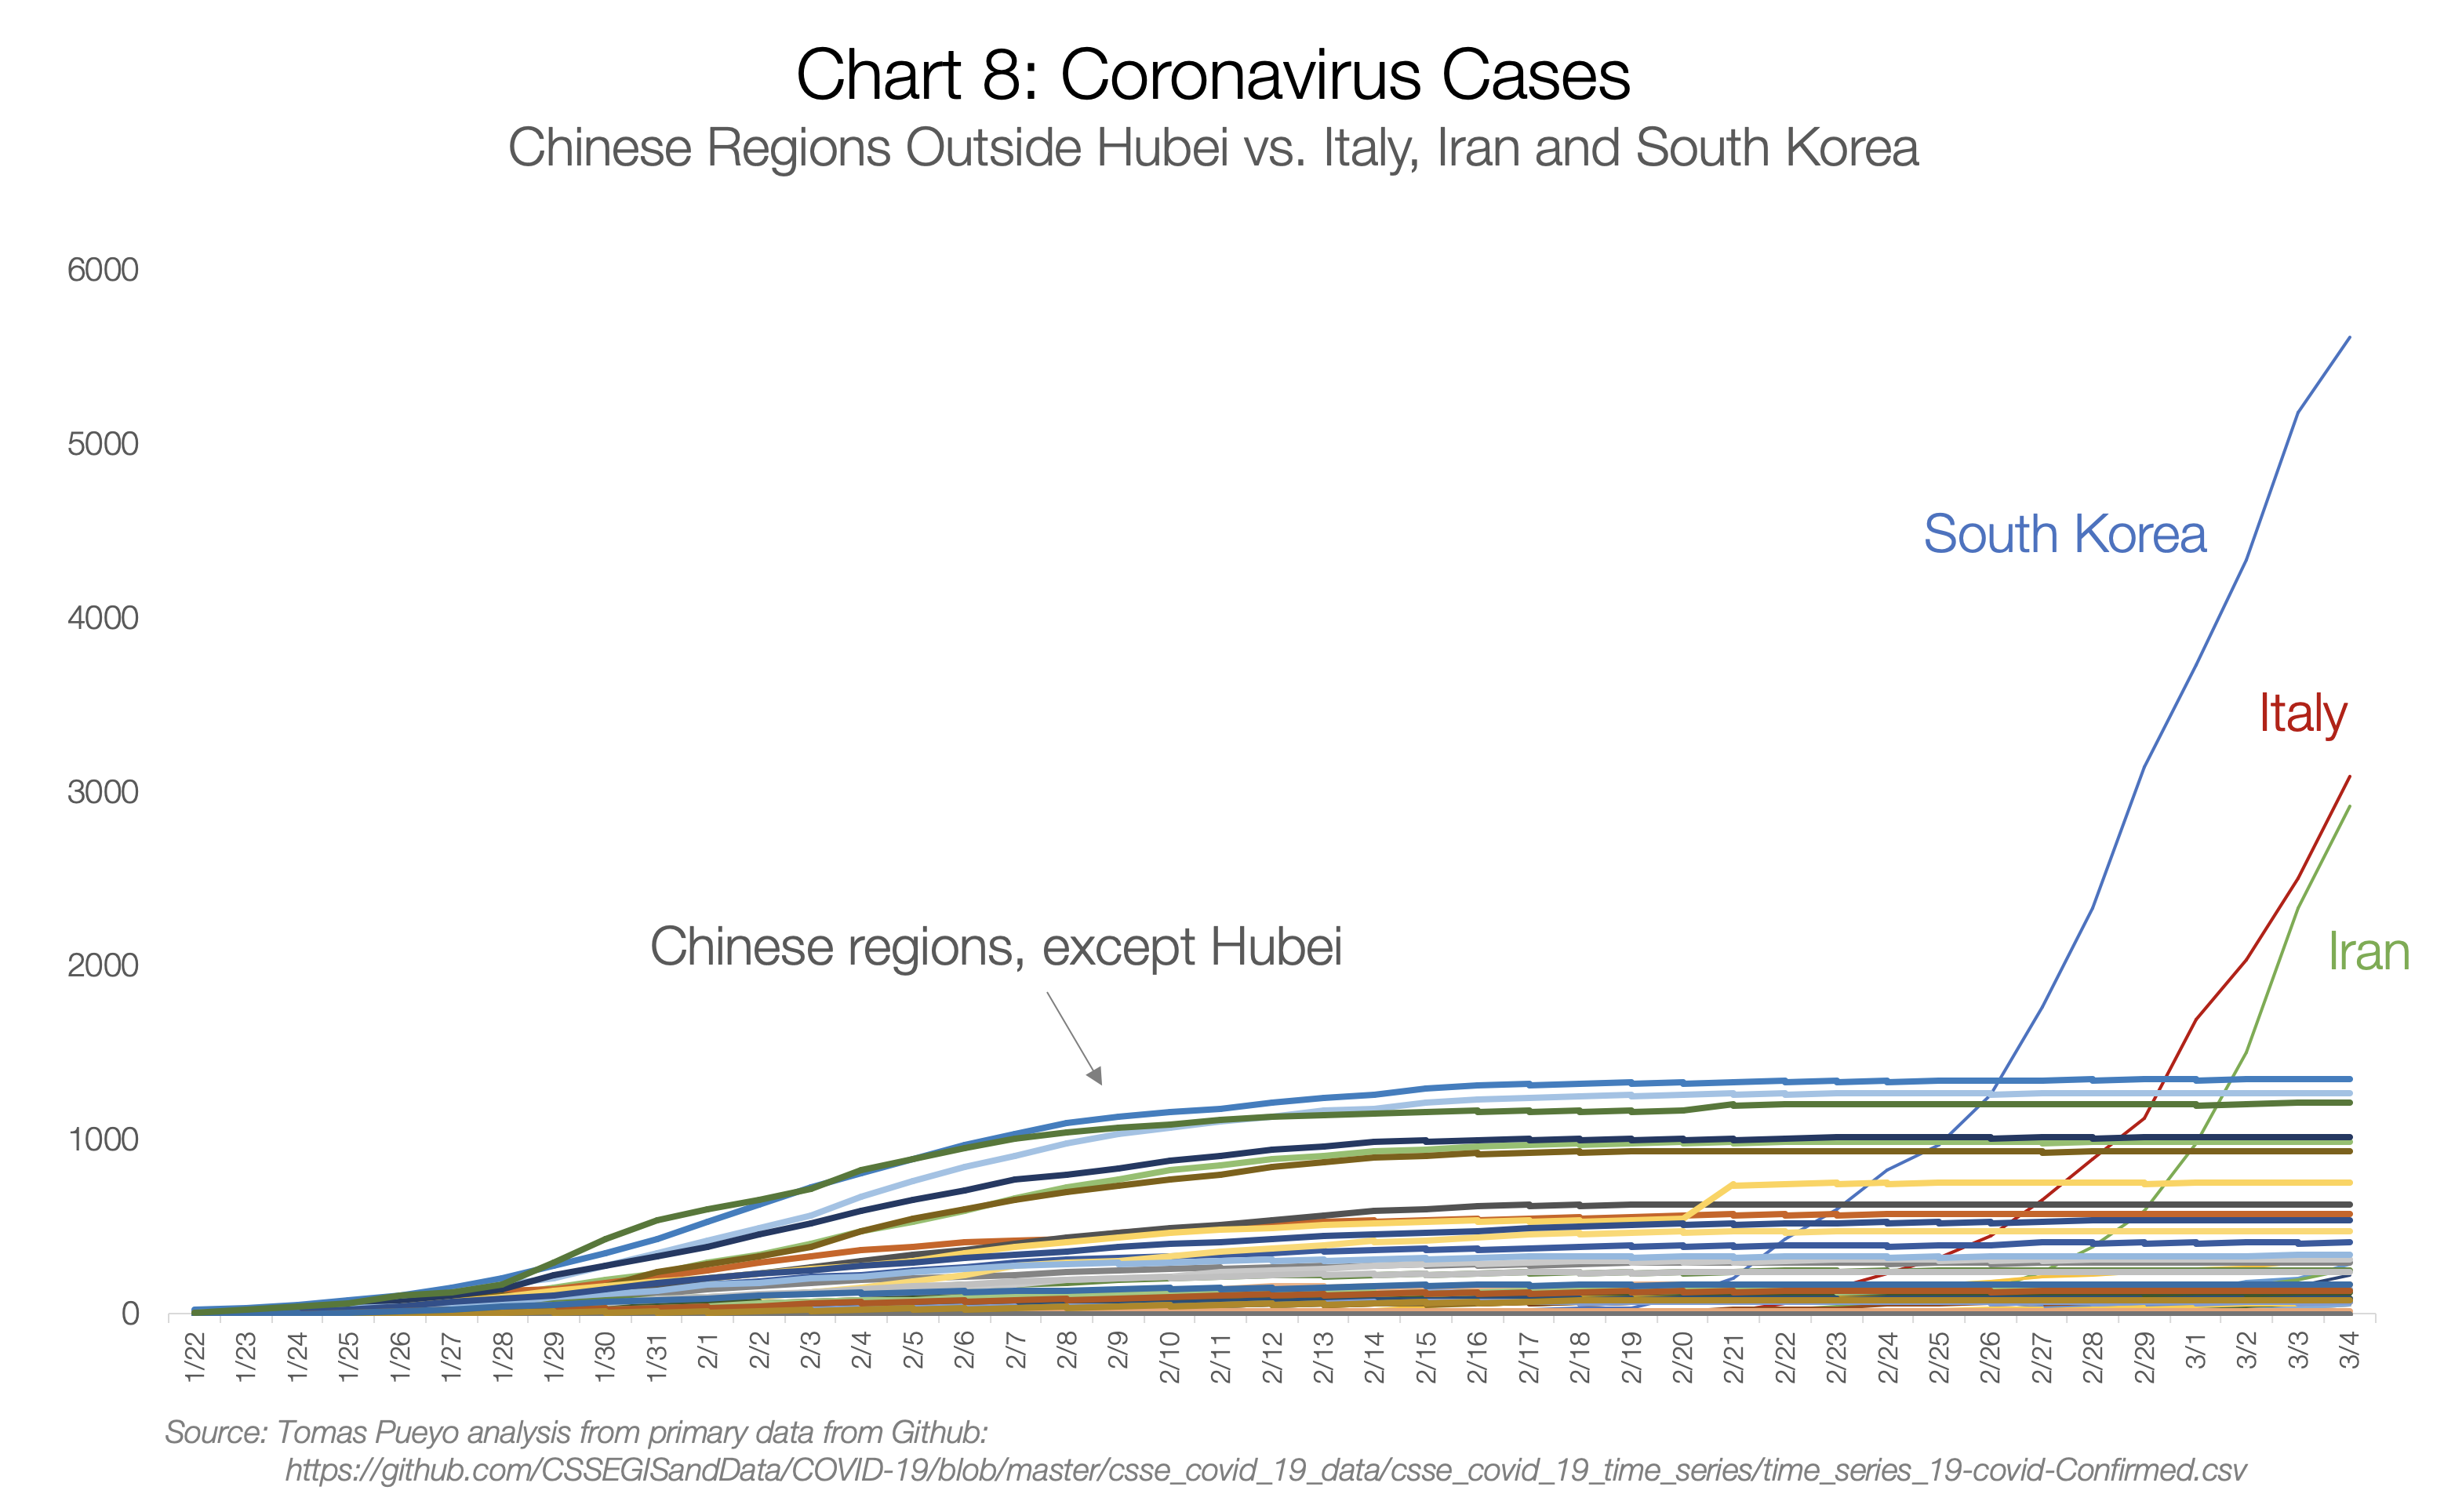
Every flat line is a Chinese region with coronavirus cases. Each one had the potential to become exponential, but thanks to the measures happening just at the end of January, all of them stopped the virus before it could spread.
Meanwhile, South Korea, Italy, and Iran had a full month to learn, but didn’t. They started the same exponential growth of Hubei and passed every other Chinese region before the end of February.
Eastern countries
South Korea cases have exploded, but have you wondered why Japan, Taiwan, Singapore, Thailand, or Hong Kong haven’t?

Taiwan didn’t even make it to this graph because it didn’t have the 50 cases threshold that I used.
All of them were hit by SARS in 2003, and all of them learned from it. They learned how viral and lethal it could be, so they knew to take it seriously. That’s why all of their graphs, despite starting to grow much earlier, still don’t look like exponentials.
So far, we have stories of coronavirus exploding, governments realizing the threat, and containing them. For the rest of the countries, however, it’s a completely different story.
Before I jump to them, a note about South Korea: The country is probably an outlier. The coronavirus was contained for the first 30 cases. Patient 31 was a super-spreader who passed it to thousands of other people. Because the virus spreads before people show symptoms, by the time the authorities realized the issue, the virus was out there. They’re now paying the consequences of that one instance. Their containment efforts show, however, that as of March 10, Italy has already passed it in numbers of cases, and Iran will soon pass it.
Washington State
You’ve already seen the growth in Western countries, and how bad forecasts of just one week look like. Now imagine that containment doesn’t happen like in Wuhan or in other Eastern countries, and you get a colossal epidemic.
Let’s look at a few cases, such as Washington state, the San Francisco Bay Area, Paris, and Madrid.
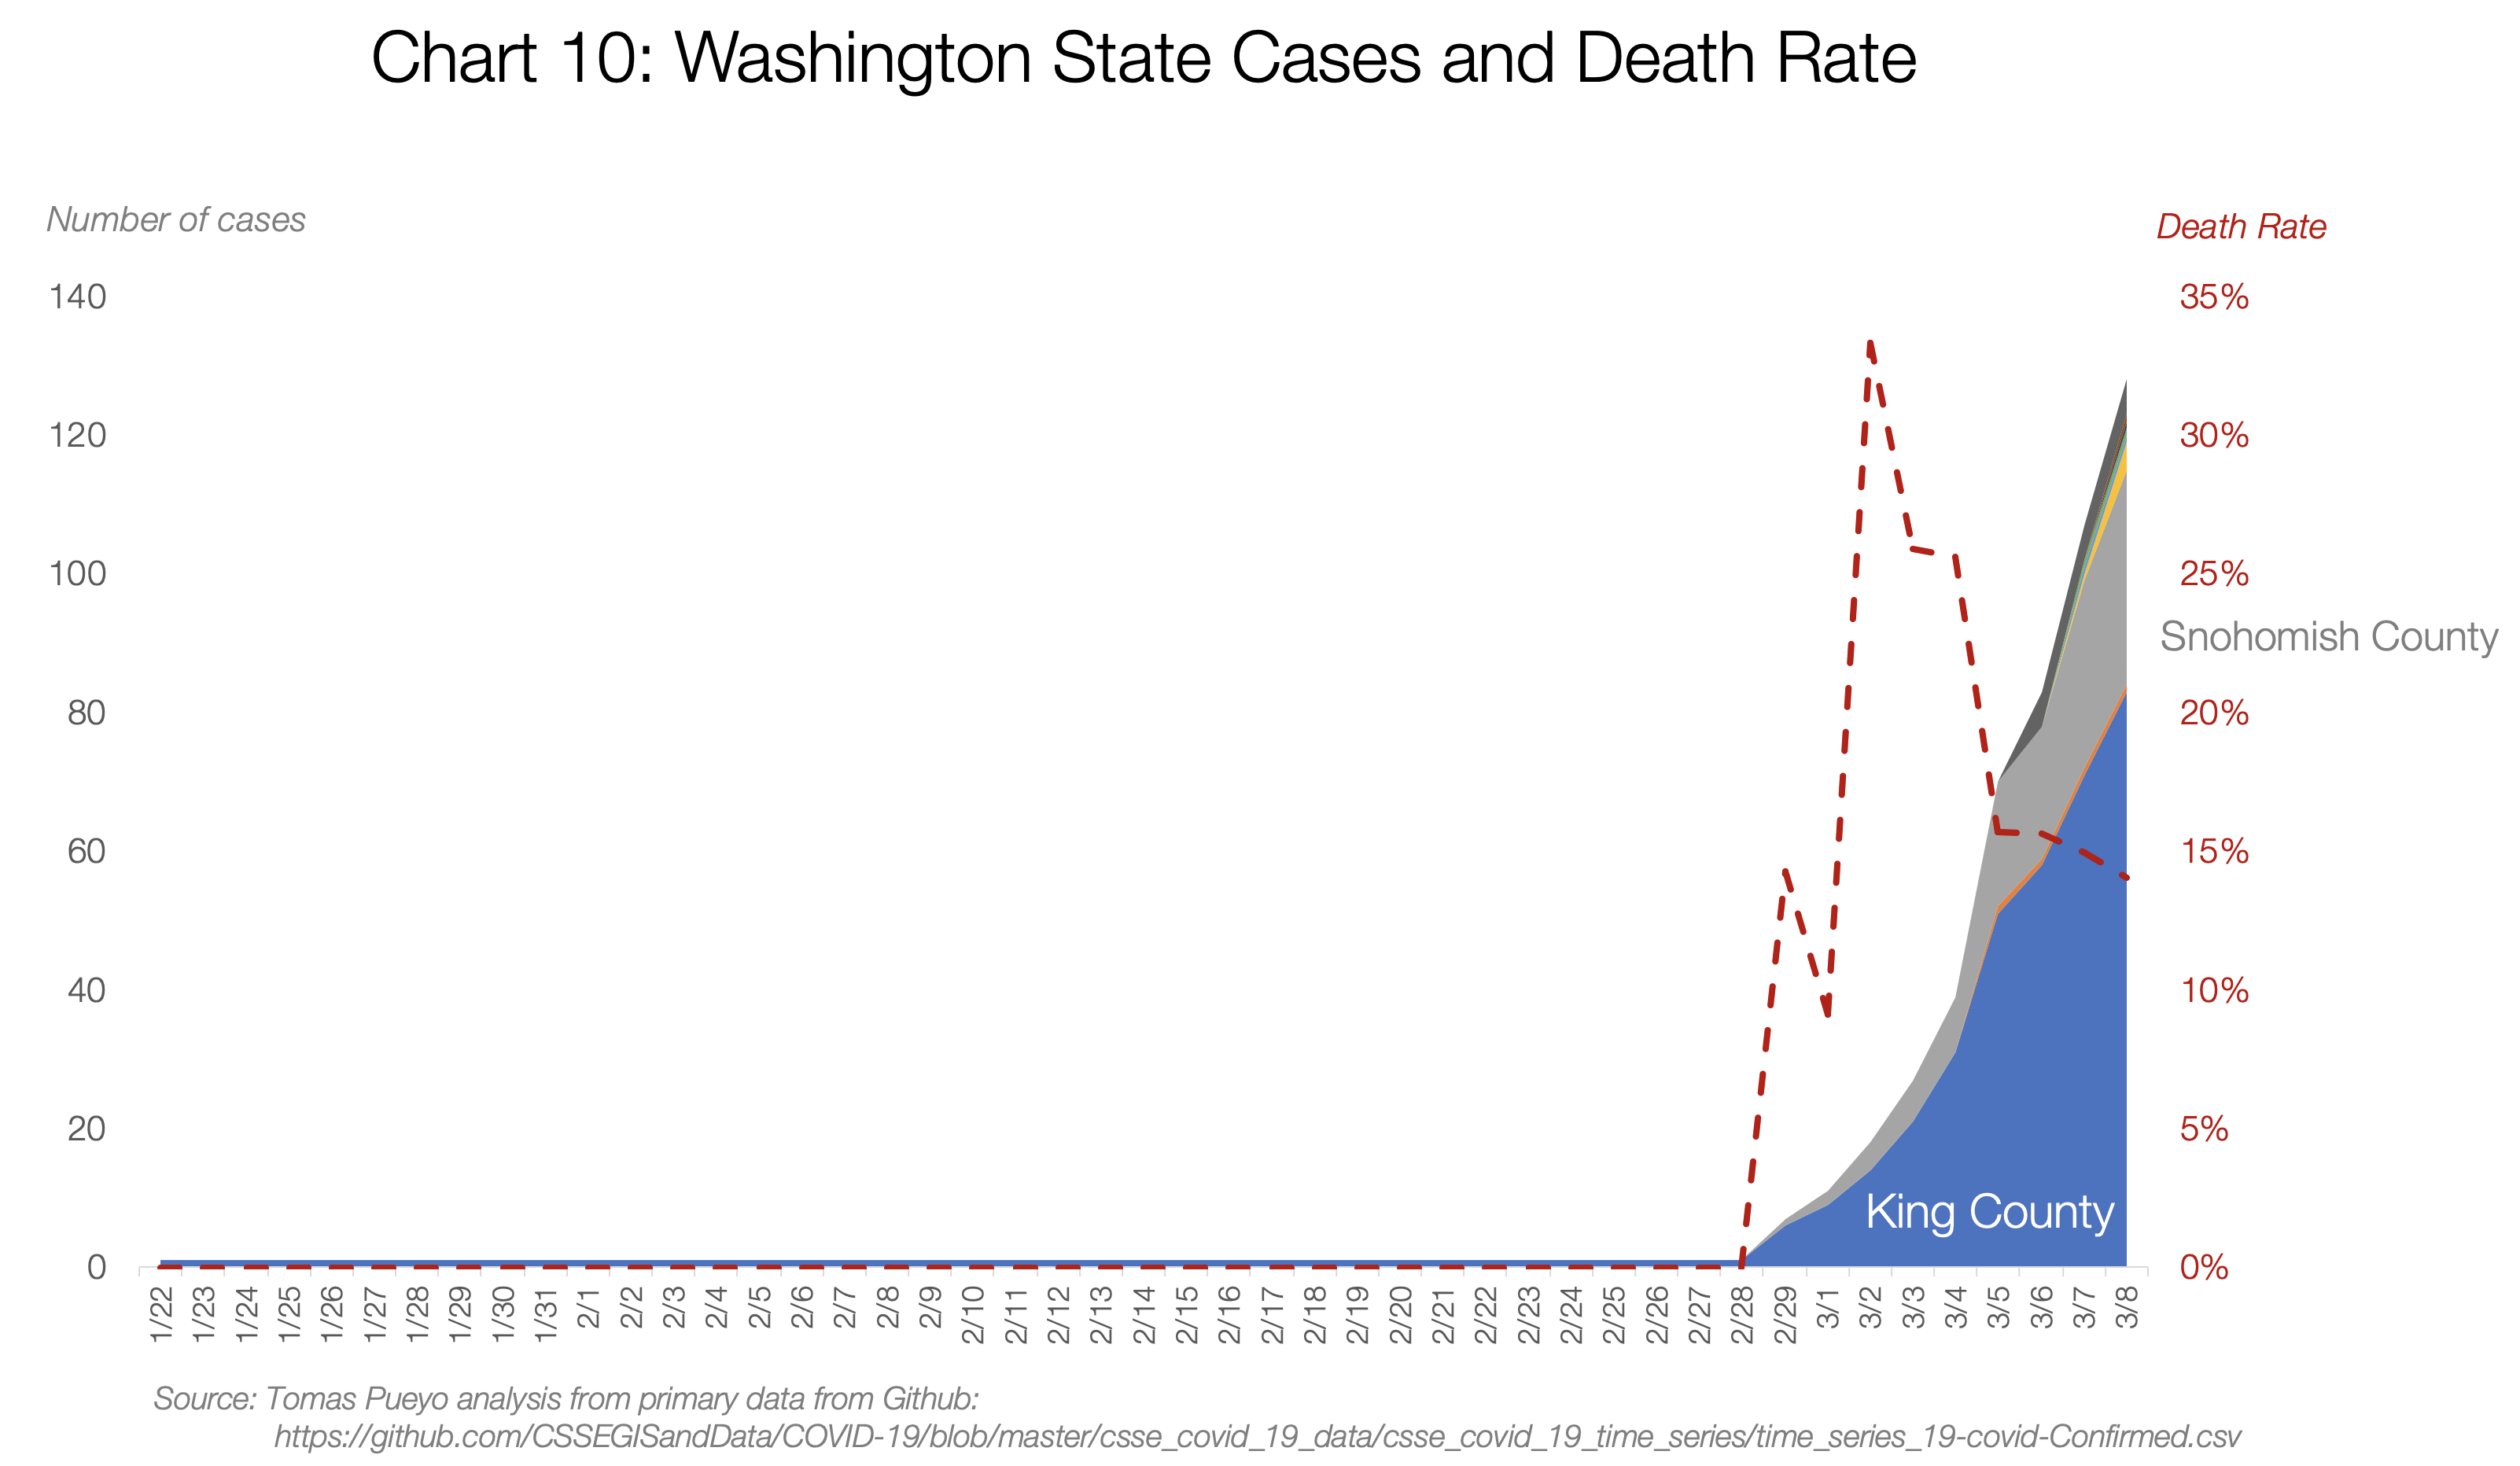
Washington state is the US’s Wuhan.The number of cases there is growing exponentially. It’s at 140, as of writing.
But something interesting happened early on. The death rate was through the roof. At some point, the state had 3 cases and one death.
We know from other places that the death rate of the coronavirus is anything between 0.5% and 5% (more on that later). How could the death rate be 33%?
It turned out that the virus had been spreading undetected for weeks. It’s not like there were only 3 cases. It’s that authorities only knew about 3, and one of them was dead because the more serious the condition, the more likely somebody is to be tested.
This is a bit like the orange and gray bars in China: Here they only knew about the orange bars (official cases) and they looked good: just 3. But in reality, there were hundreds, maybe thousands of true cases.
This is an issue: You only know the official cases, not the true ones. But you need to know the true ones. How can you estimate the true ones? It turns out, there’s a couple of ways. And I have a model for both, so you can play with the numbers too.
First, through deaths. If you have deaths in your region, you can use that to guess the number of true current cases. We know approximately how long it takes for that person to go from catching the virus to dying on average (17.3 days). That means the person who died on 2/29 in Washington state probably got infected around 2/12.
Then, you know the mortality rate. For this scenario, I’m using 1% (we’ll discuss later the details). That means that, around 2/12, there were already around ~100 cases in the area (of which only one ended up in death 17.3 days later).
Now, use the average doubling time for the coronavirus (time it takes to double cases, on average). It’s 6.2. That means that, in the 17 days it took this person to die, the cases had to multiply by ~8 (=2^(17/6)). That means that, if you are not diagnosing all cases, one death today means 800 true cases today.
Washington state has 22 deaths, as of March 10. With that quick calculation, you get ~16,000 true coronavirus cases. As many as the official cases in Italy and Iran combined, for the same period.
If we look into the detail, we realize that 19 of these deaths were from one cluster, which might not have spread the virus widely. So if we consider those 19 deaths as one, the total deaths in the state is 4. Updating the model with that number, we still get ~3,000 cases today.
This approach from Trevor Bedford looks at the viruses themselves and their mutations to assess the current case count.
An update about what we’re able to infer about the Washington State #COVID19 outbreak from screening and viral sequencing by @UWVirology and @seattleflustudy. 1/12
The conclusion is that there are likely ~1,100 cases in Washington state as of writing.
None of these approaches are perfect, but they all point to the same message: We don’t know the number of true cases, but it’s much higher than the official one. It’s not in the hundreds. It’s in the thousands, maybe more.
San Francisco Bay Area
Until 3/8, the Bay Area didn’t have any death. That made it hard to know how many true cases there were. Officially, there were 86 cases. But the US is vastly undertesting because it doesn’t have enough kits. The country decided to create their own test kit, which turned out not to work.
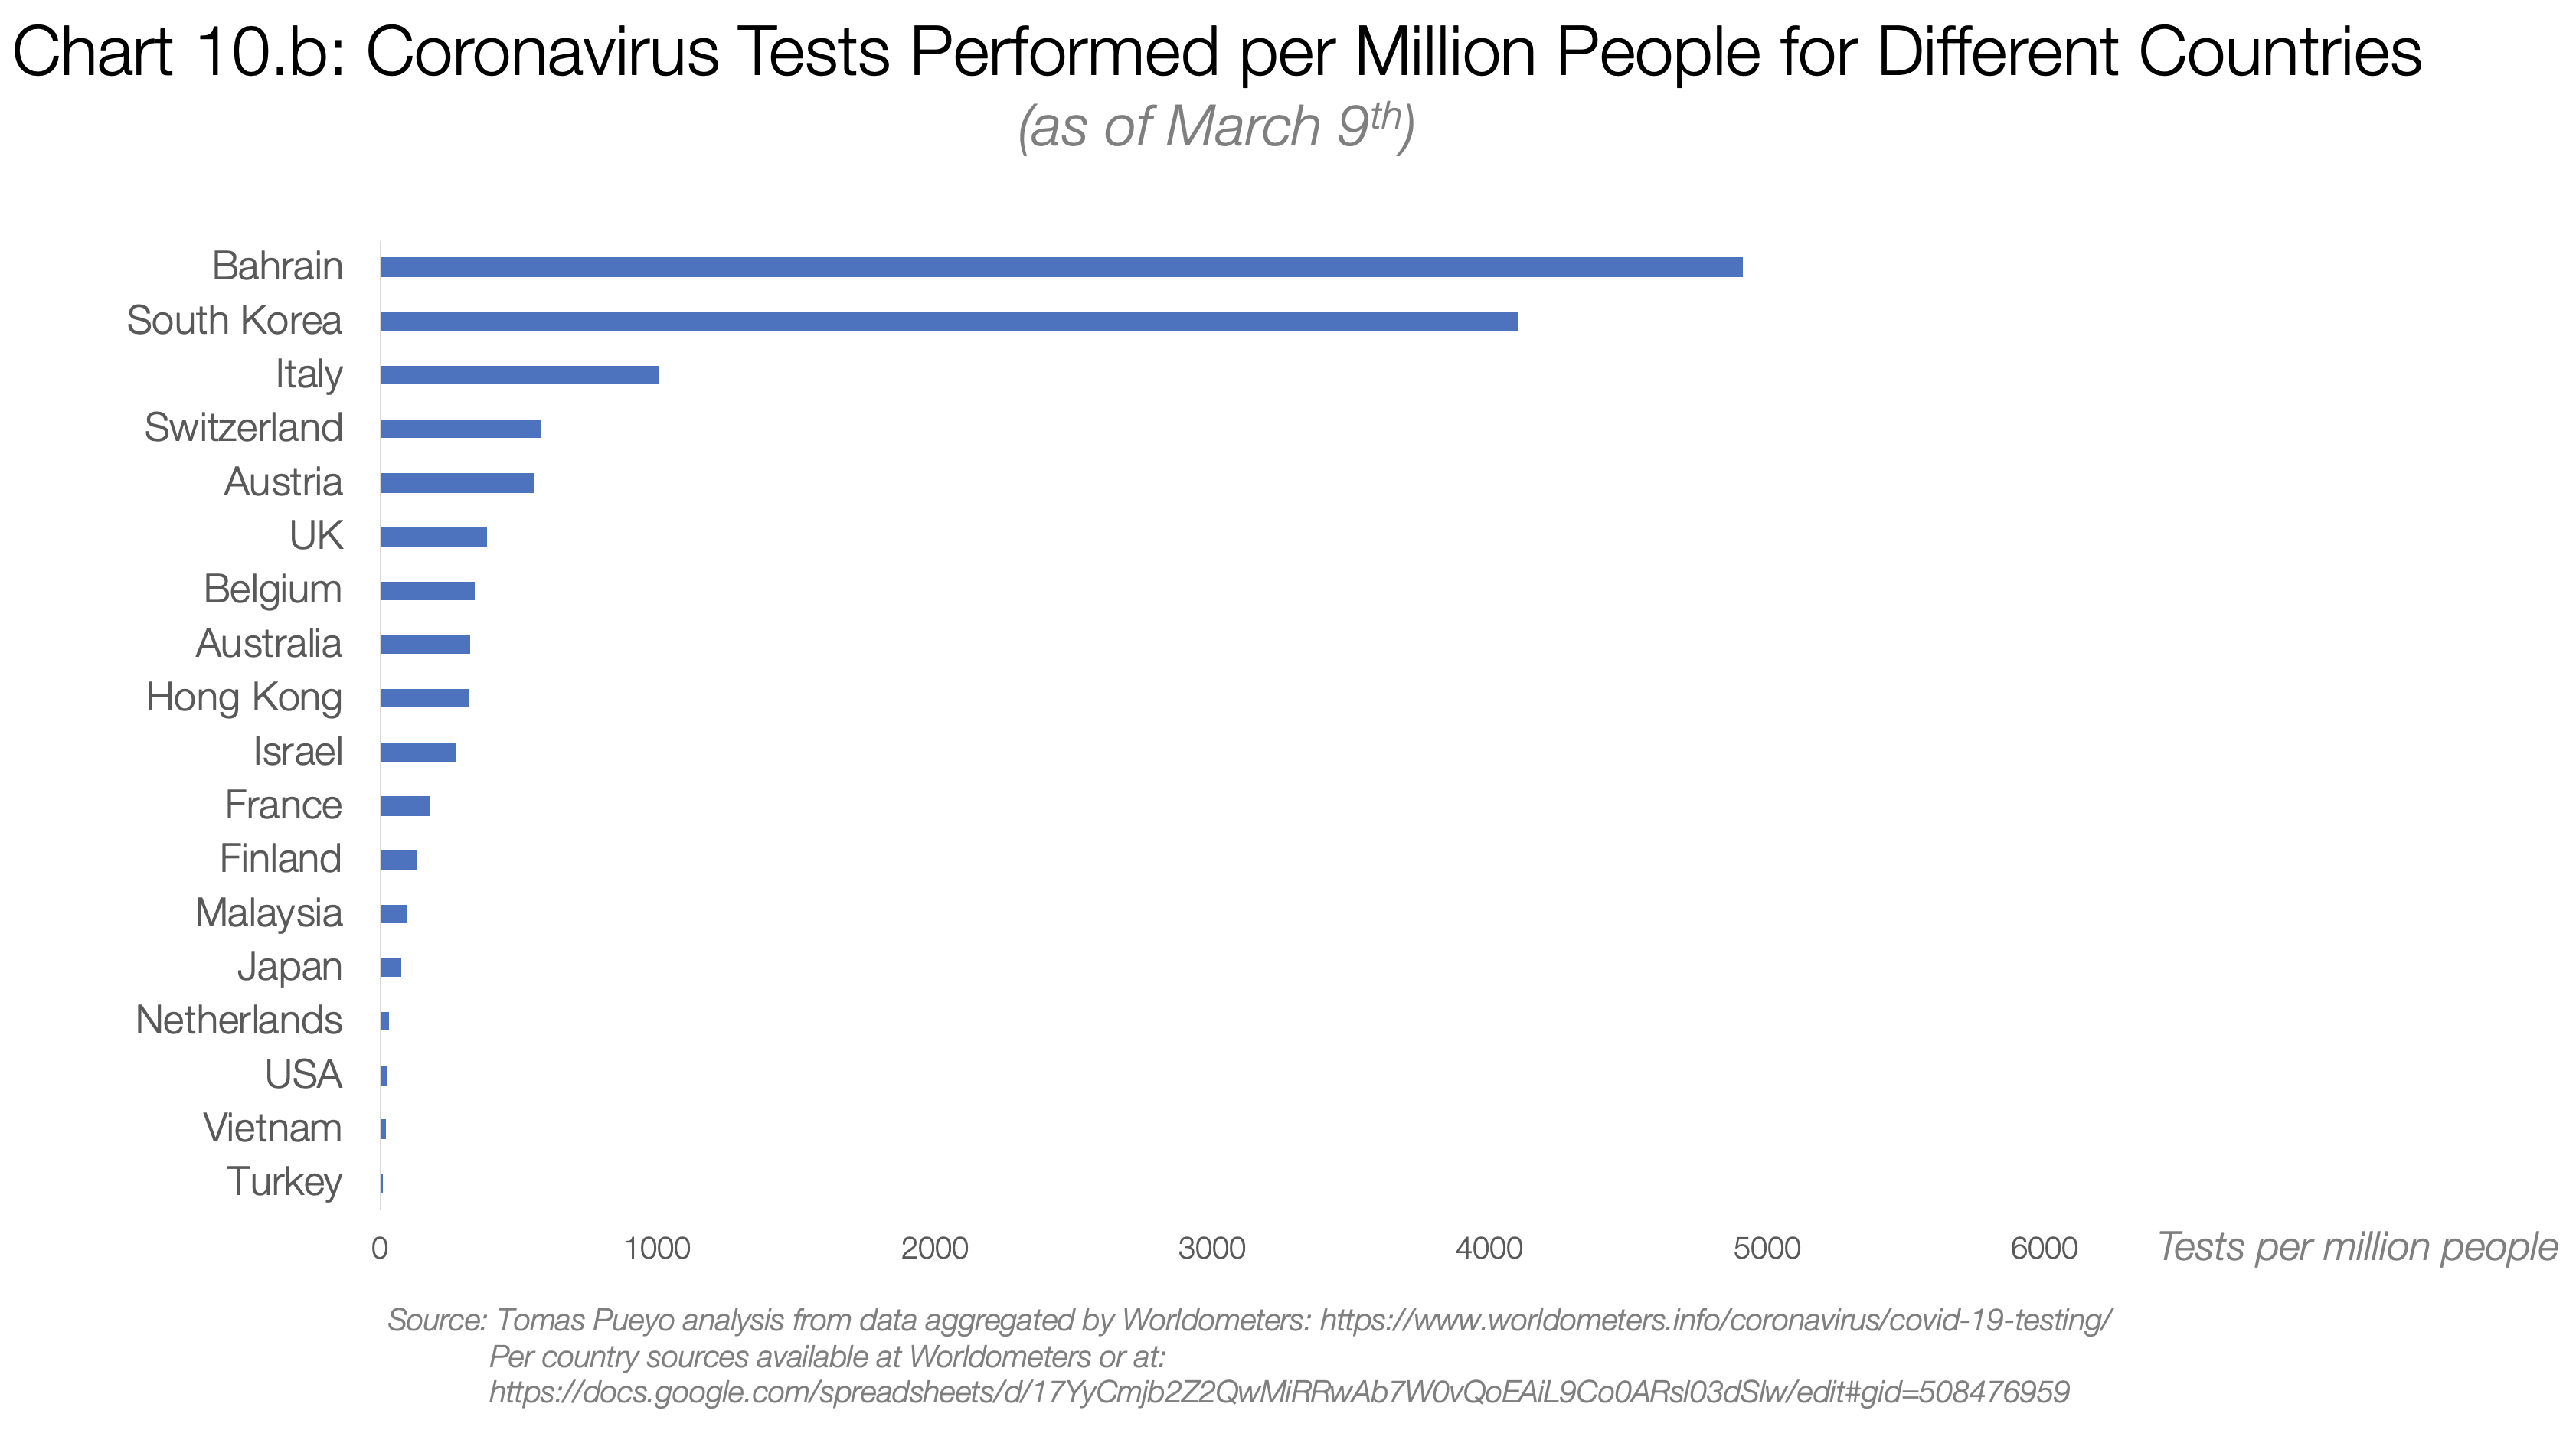
These were the number of tests carried out in different countries by March 3rd:
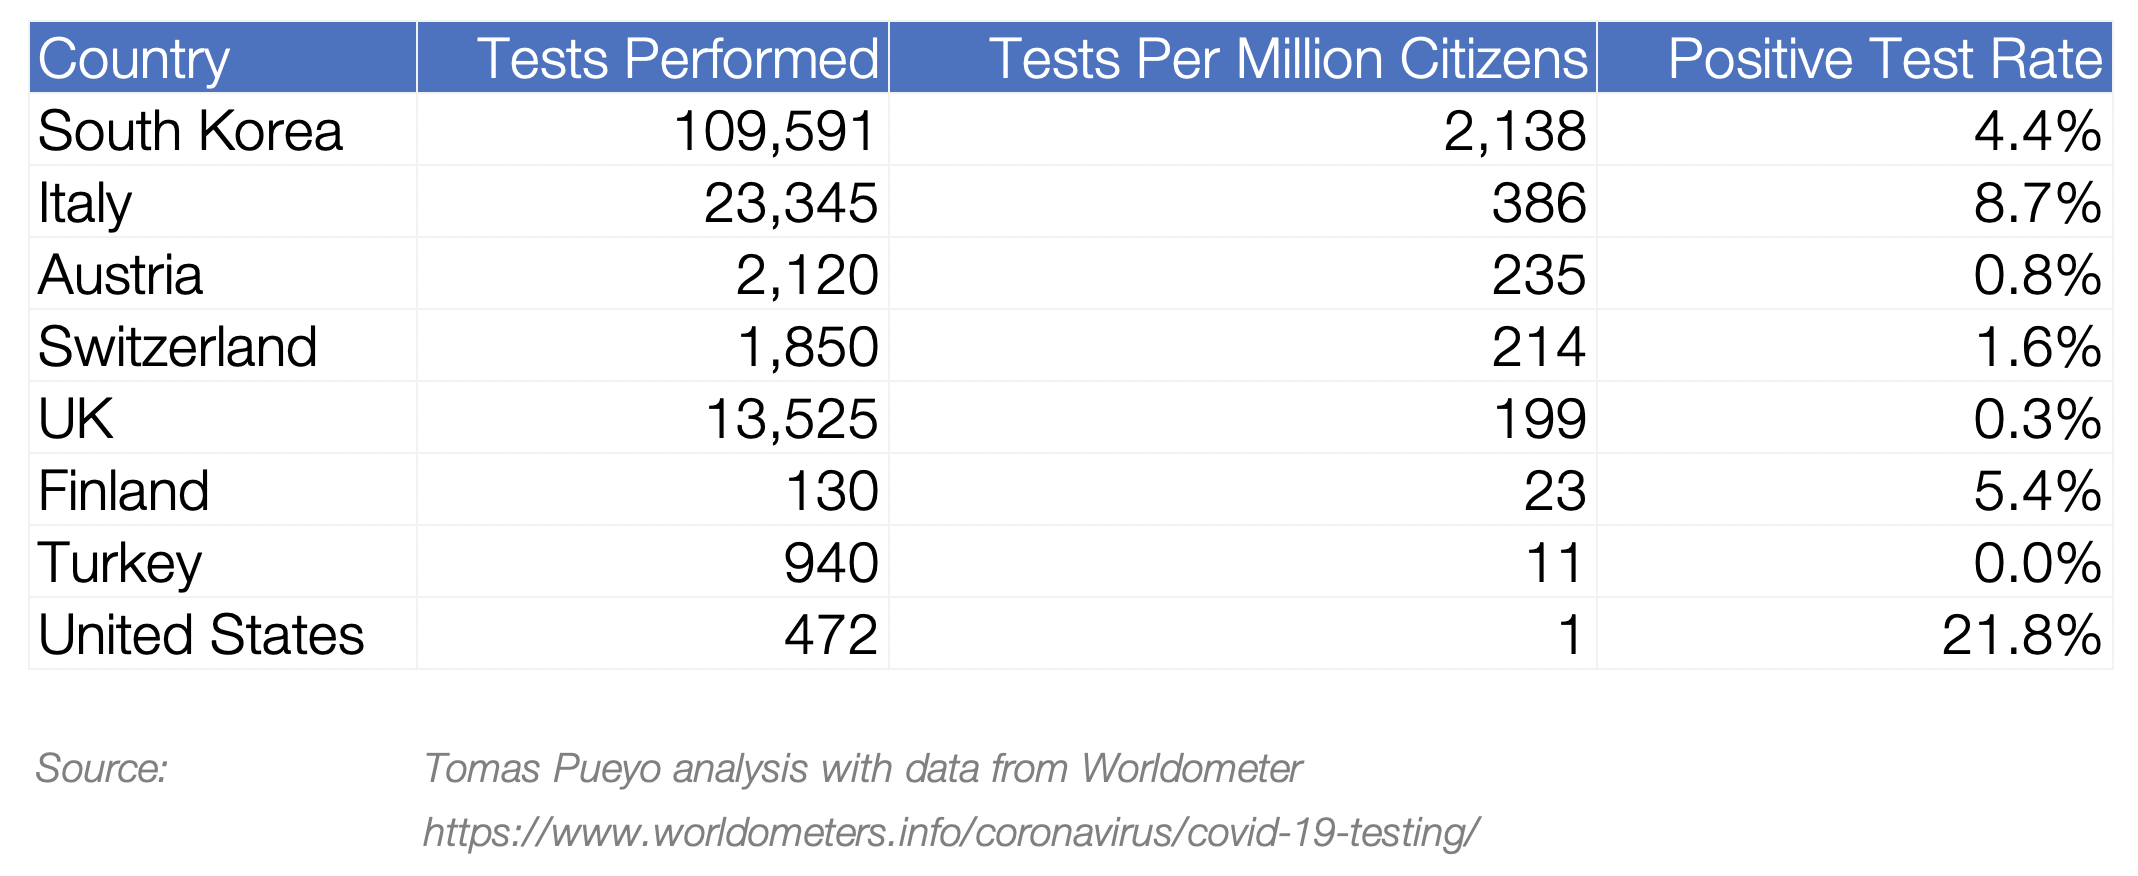
Turkey, with no cases of coronavirus, had 10 times the testing per inhabitant than the US. The situation is not much better as of writing, with ~8,000 tests performed in the US, which means ~4,000 people have been tested.
Here, you can just use a share of official cases to true cases. How to decide which one? For the Bay Area, they were testing everybody who had traveled or was in contact with a traveler, which means that they knew most of the travel-related cases, but none of the community spread cases. By having a sense of community spread vs. travel spread, you can know how many true cases there are.
I looked at that ratio for South Korea, which has great data. By the time they had 86 cases, the % of them from community spread was 86% (86 and 86% are a coincidence).
With that number, you can calculate the number of true cases. If the Bay Area has 86 cases today, it is likely that the true number is ~600.
France and Paris
France claims 1,400 cases and 30 deaths as of writing. Using the two methods above, you can have a range of cases: between 24,000 and 140,000.
Let me repeat that: the number of true cases in France is likely to be between one and two orders or magnitude higher than it is officially reported.
Don’t believe me? Let’s look at the Wuhan graph again.
Source: Tomas Pueyo analysis over chart and data from the Journal of the American Medical Association
If you stack up the orange bars until 1/22, you get 444 cases. Now add up all the gray bars. They add up to ~12,000 cases. So when Wuhan thought it had 444 cases, it had 27 times more. If France thinks it has 1,400 cases, it might well have tens of thousands.
The same math applies to Paris. With ~30 cases inside the city, the true number of cases is likely to be in the hundreds, maybe thousands. With 300 cases in the Ile-de-France region, the total cases in the region might already exceed tens of thousands.
Spain and Madrid
Spain has very similar numbers as France (1,200 cases vs. 1,400, and both have 30 deaths). That means the same rules are valid: Spain has probably upwards of 20k true cases already.
In the Comunidad de Madrid region, with 600 official cases and 17 deaths, the true number of cases is likely between 10,000 and 60,000.
If you read these data and tell yourself: “Impossible, this can’t be true,” just think this: With this number of cases, Wuhan was already in lockdown.
And if you’re telling yourself: “Well, Hubei is just one region,” let me remind you that it has nearly 60 million people, bigger than Spain and about the size of France. (To be concluded) – Rappler.com
READ: Concluding Part | COVID-19: The difference in death rates
*Tomas Pueyo is a Silicon Valley entrepreneur and behavioral psychologist who specializes in exponential growth. He wrote the Medium post, “Coronavirus: Why You Must Act Now,” which was read by tens of millions of people around the world.
Add a comment
How does this make you feel?


![[In This Economy] Is the Philippines quietly getting richer?](https://www.rappler.com/tachyon/2024/04/20240426-Philippines-quietly-getting-richer.jpg?resize=257%2C257&crop=194px%2C0px%2C720px%2C720px)


There are no comments yet. Add your comment to start the conversation.