SUMMARY
This is AI generated summarization, which may have errors. For context, always refer to the full article.
![[ANALYSIS] Part 2: Survey says or not](https://www.rappler.com/tachyon/2021/10/duterte-survey-sq.jpeg)
Part 2 of 3
This is the second of a three-part series based on the 20th Jaime V. Ongpin Memorial Lecture on Public Service in Business and Government delivered last October 27, 2021.
![[ANALYSIS] Part 1: Survey says or not](https://www.rappler.com/tachyon/2021/10/opinion-survey-says-or-not-sq.jpeg?fit=449%2C449)
The first part of this three-part series described the science behind sample surveys. This next part identifies several opinion poll outfits and the people leading these firms, and then describes methods and practices used by a few firms that have built track records. We close here with discussions of trends in approval/satisfaction ratings of presidents of the Philippines. Voter preferences data is discussed in the third and final part of this series of articles, which includes some practical advice to the media and the public, on having a critical reading of sample surveys.
Are election surveys regulated in the Philippines?
Unlike in Montenegro where election surveys are forbidden, in the Philippines, election surveys are allowed, though regulated by virtue of the Fair Elections Act of 2001 (RA 9006). According to Section 5.4 of this law, election surveys are allowed if they are published more than fifteen (15) days before an election for national candidates, and more than seven (7) days before an election for local candidates. However, the Supreme Court ruled that this portion of the law is unconstitutional and violative of the freedom of expression.
The law mandates a candidate, political party, and polling firm to release the relevant information – like who paid for the survey, who conducted the survey, methodology, areas covered, the specific questions asked, margin of error. It also mandates for transparency purposes, that the survey, together with its supporting raw data, be made available for inspection, copying, and verification by the Commission on Elections (Comelec), a registered political party, a bona fide candidate, or by any Comelec-accredited citizen’s arm.
What organizations conduct election surveys in the Philippines?
I asked my research assistant Mika Muñoz for help to identify poll outfits in the Philippines, and she managed to list 13 of them: IBON, a CSO that focuses on development issues; OctaResearch, which gained fame for advisories on the pandemic; DigiVoice a new firm that intends to use digital tech for opinion polling; PUBLICUS, a lobbying firm; BOSES PILIPINAS, a new player from the academe; D’ Strafford Research & Strategies, a consulting firm; another consulting firm, Laylo Research Strategies, two radio networks – Manila Broadcasting Company and Radio Mindanao Network – and two rather well-known outfits that have, so far, lasted decades and which most of us might already know of: Social Weather Stations (SWS) and Pulse Asia. The first 11 firms mentioned have conducted election surveys at various points in time, while the last two have been regular producers of election surveys.
SWS and Pulse Asia are headed by Linda “Da” Guerrero and Ronald “Ronnie” Holmes, respectively. Da took the mantle of leadership from Mahar Mangahas only last month. SWS was established in 1985 by Mahar and several fellows, including Pepe Miranda, who quit from SWS to establish Pulse Asia, and subsequently gave the leadership to Ronnie Holmes several years ago. Let me disclose that I am an elected fellow of SWS, but that is largely honorific. The only benefit I get from being an SWS fellow is that I get weekly emails on Mahar’s columns as well as advisories on reports of SWS.
How exactly do SWS and Pulse Asia operate?
SWS and Pulse Asia run dedicated surveys, and charge people and institutions for subscription to survey results. They also have commissioned surveys, and also conduct various market research studies and consultancies.
In their websites you can get information on their dedicated surveys, election polls, and their methodologies. How they conduct their surveys is pretty much the standard way of conducting surveys that I described in the first part of this series: they design their surveys and questionnaires, determine appropriate sample sizes, select areas for operations, conduct the survey operations, process and analyze the survey data, and finally communicate the results to the public.
What kind of questions do they ask in their surveys?
As regards voting preferences, SWS and Pulse Asia pose fairly similar survey questions: sino po ang inyong iboboto, or sino ang pinakamalamang ninyong iboboto (see Figure 1).
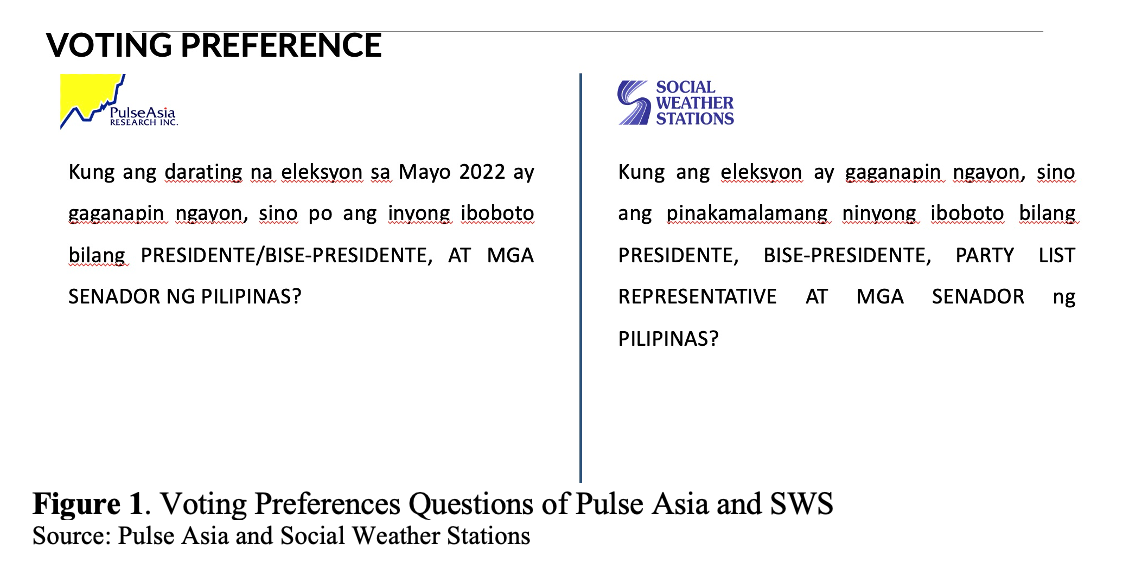
There are also extra rider questions that SWS and Pulse Asia subscribers might pay for, such as, suppose we have a four-cornered race among A to D, who would you vote for? (And the results of these rider questions are often not released by these institutions, though the subscriber often would release these to the public if the results are favorable to them, for their psywar tactics).
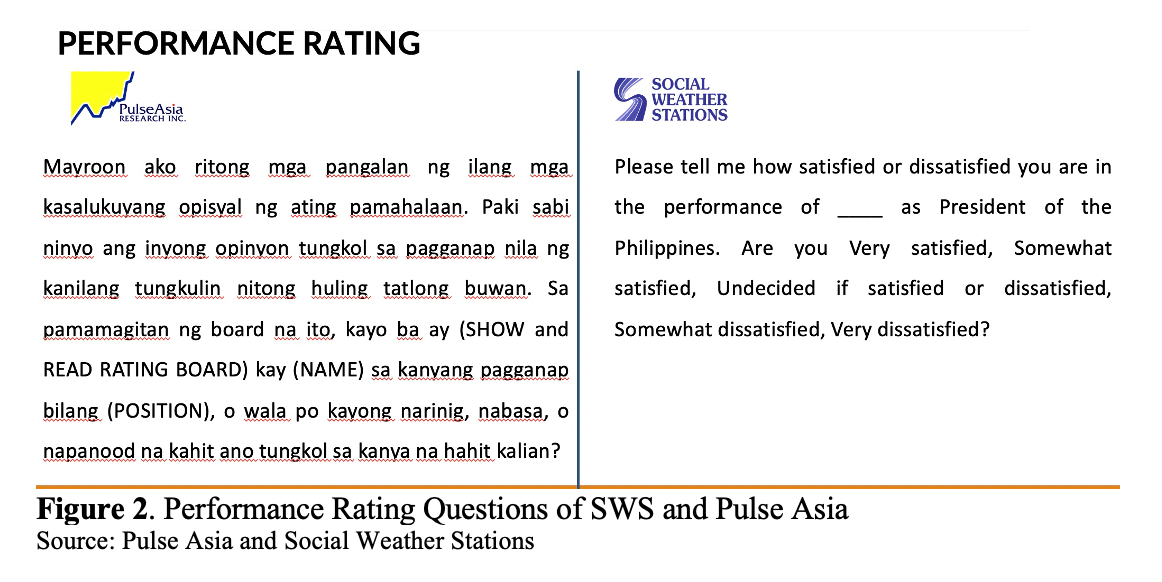
Where the two organizations substantially differ is on measuring performance of government officials (see Figure 2). SWS uses the term satisfaction, while Pulse Asia uses the traditional concept of approval. Although these two concepts are related, they are clearly not equivalent, and this accounts for the variance, if any, in their survey results to measure the public’s view of the performance of government officials.
Does question wording really matter?
Of course it does. As far back as 1941, Donald Rugg published a two-page article in Public Opinion Quarterly, reporting on a test of two questions about speeches against democracy. He did what’s known as a “split-ballot experiment.” One half of the sample, randomly selected, was asked:
“Do you think that the United States should forbid public speeches against democracy?”
More than half (54%) of respondents said “yes.”
When asked, “Do you think the United States should allow speeches against democracy?” a quarter (25%) said “yes,” suggesting that 75% would not allow such public speeches.
While these two questions about allowing or forbidding speeches against democracy seem like mirror images of each other, what turned Rugg’s split-ballot experiment in question wording into a journal article was that they were not. So, which is it, then 54% or 75%?
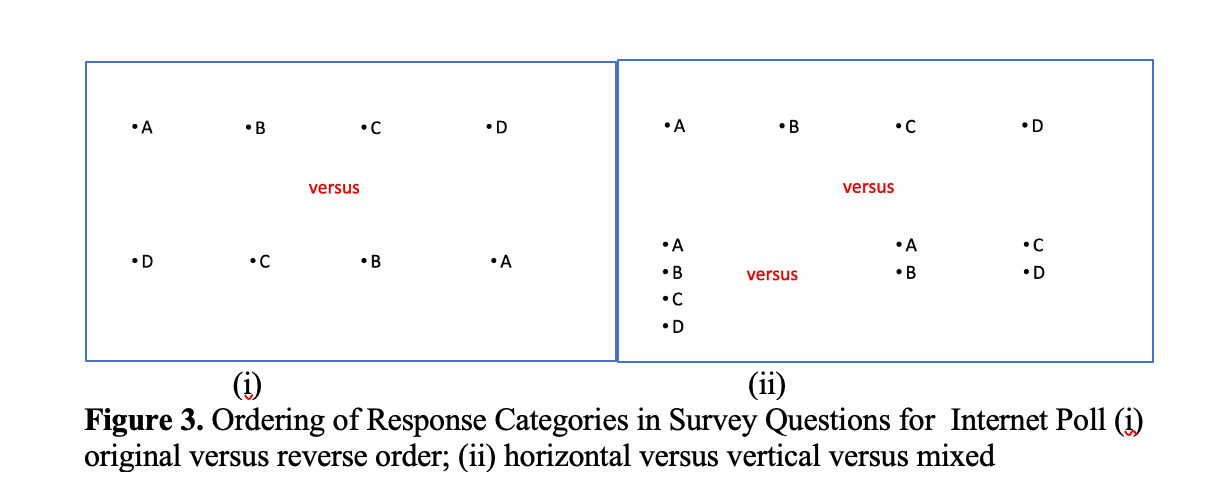
In 2003, I attended a fascinating session in the World Statistics Congress (then called International Statistical Institute conference in Germany) that discussed internet polls, and how split sample experiments suggested that even the ordering of categories for questions mattered, whether categories are presented in reverse order, or differently (see Figure 3). Thus it is important to scrutinize how questions are being asked in surveys.
How are respondents selected in Pulse Asia and SWS polls?
Both Pulse Asia and SWS interview 1,200 respondents for many of their surveys: 5 respondents per “sample spot,” with the respondents chosen through a multi-stage probability sampling scheme. Outside NCR, provinces are selected (though slightly differently for the two organizations), then within each selected province, barangays are chosen, then the households within the selected barangays, and finally an adult respondent is chosen, stratified by sex, in the sample household. And because they use 1,200 respondents, their margin of error would be 3 percentage points. The margin of error, as pointed out in the first part of this series, is inversely proportional to the square root of the sample size. Thus, when using 1,200 respondents, the margin of error is:
Getting a reading in their four subnational areas: NCR, balance Luzon, Visayas, and Mindanao would give a reading that has 6 percentage points margin of error, since the sample sizes in these areas (400 respondents) are one-fourth of the national sample, and thus, the precision would decrease by a factor of 2 from the national reading, i.e. the margin of error for these areas is double the margin of error at the national level.
In each selected sample household, a respondent is randomly chosen from among household members who are 18 years or older, using a probability selection table. Respondents are stratified by sex. To ensure that half of the respondents are male and half are female, only male family members are pre-listed in the probability selection table of odd-numbered questionnaires while only female members are pre-listed for even-numbered questionnaires.
What trends do we find in performance ratings of Philippine presidents?
SWS satisfaction ratings data shows that President Duterte has been given very strong support by Filipinos with regard to his overall “pamamalakad” throughout his term, though of late, ratings have dropped to 75%. According to SWS, the perceived decisiveness and diligence are reasons for high ratings.
When we look at the corresponding approval ratings, and trust ratings monitored by Pulse Asia, we see a similar pattern though the levels aren’t quite the same, owing to the difference in concepts of satisfaction, approval, and trust. We notice when we compare the ratings of Duterte with past presidents, they are among the highest tracked ever post-EDSA. The lowest performance was given to Gloria Macapagal-Arroyo, whether in terms of satisfaction, approval or trust.
What I find interesting and amazing is that despite the difference in concepts of satisfaction and approval, when we look at net satisfaction and net approval, the figures and trends come very close (Figure 4). Further, we can notice that we tend to have honeymoon periods with all our leaders, even with Arroyo who received the lowest approval and satisfaction ratings among post-EDSA presidents. Only Duterte appears to have maintained his popularity, although some suggest that the most recent data would indicate the start of a crack.
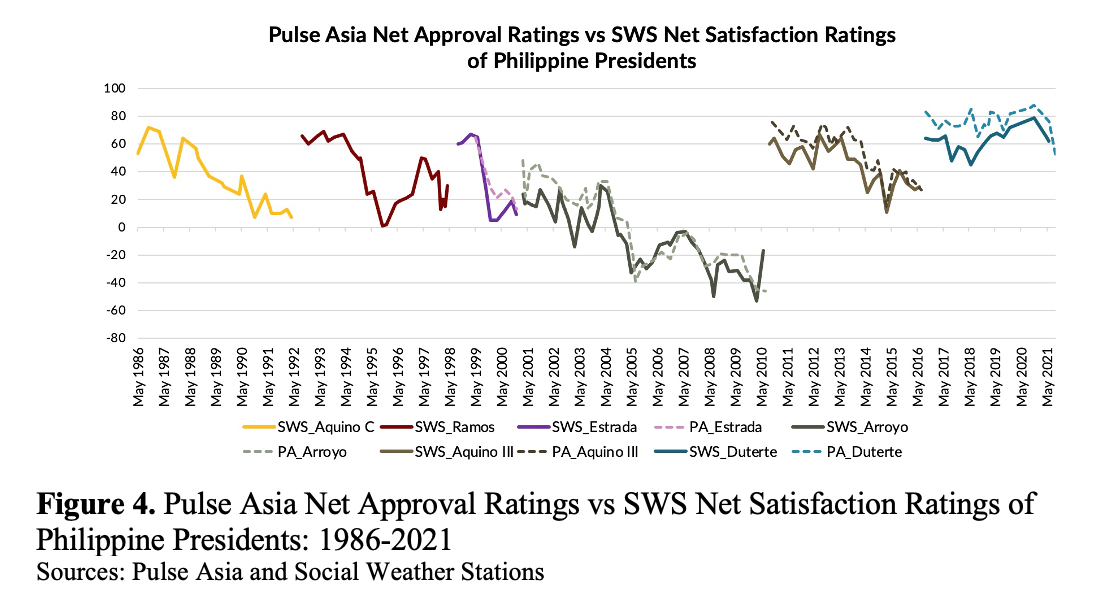
Duterte’s worst year for approval/satisfaction ratings appears to have been in 2018. The June 2018 survey was conducted right after he called God “stupid”. The September 2018 drop was after a rice shortage that led to record-high inflation, but he bounced back in 2019 and maintained popularity even in 2020 amid the pandemic.
In my travels prior to the pandemic, many Westerners would ask me why a country that is predominantly Roman Catholic would give Duterte such favorable ratings. One person even asked me, “Where is the consistency between your religion and the approval you give to the killings in your drug war?”
What explains the high approval for Duterte?
The survey data do not tell us directly why people approve or are satisfied with a leader’s performance, or why these aggregates change across time. Pundits provide conjectures, and interpretations of the data. In this case, for instance some political observers such as Randy David, John Nery, Oscar Lagman, and Luis Teodoro have attributed the very high ratings for the current President to a “fear factor”. In a webinar held last month organized by SWS, SWS fellow Geoffrey Ducanes said, “One can also ask…how much is driven by fear of expressing dissatisfaction so that what is observed is not real satisfaction?”
Ideally, survey respondents should feel secure to disclose accurate information, including opinions during a face-to-face (FTF) interview, but a growing amount of literature in survey research discusses “fear” in survey responses in Africa (Zimbalist 2018; 2021; Calvo et al 2019; and even in the US (Ekins 2020), where as much as three-fifths (62%) of Americans say they have political views they’re afraid to share and about a third (32%) are worried about missing out on job opportunities because of their political opinions.
Studies in Africa suggest that the presence even of a bystander would affect survey responses. Studying the presence of bystanders and the fear it yields to survey responses is important because third parties are often present in surveys, especially in developing country contexts where extended family members and communities live in close proximity.
As regards the high approval/satisfaction for Duterte, while Pulse Asia’s president Ronnie Holmes and several fellows of SWS admit that fear cannot be ruled out, the measurement of fear can be quite challenging. Both Pulse Asia’s senior research fellow Ana Tabunda and SWS board member Steven Rood said that that there are currently no nonverbal signals from their respective survey respondents to support the “fear factor” conjecture.
Still, it is worth pointing out that half (51%) of Filipinos in the SWS July 3-6, 2020, National Mobile Phone Survey agree that “it is dangerous to print or broadcast anything critical of the administration, even if it is the truth.” But this may just mean that Filipinos think it is dangerous for the media to be critical, but they feel free to say what they want.
As I was ending the content of this lecture, I was informed that Ronnie Holmes together with Yuko Kasuya (Keio University) and Hirofumi Miwa (Gakushuin University) delivered a paper at the Philippine Political Studies Association Annual Meeting, last June 15, 2021 where they presented the results of a list experiment.
In short, they found empirical evidence, through a Pulse Asia survey, that about one-third of Duterte’s approval rating came from social desirability bias (i.e., respondents not giving truthful answers in surveys) as of early 2021. Further, Filipinos who believe their neighbors support Duterte were more likely to succumb to this social desirability bias. The implications of this fascinating paper would suggest that support for Duterte may wane quickly when people perceive he is no longer popular, and that a high support for authoritarian populist leaders should not be interpreted as an indication that voters are giving up on democracy, as some pundits have argued.
Are there factors, aside from fear, that explain Duterte’s high popularity?
Although I am no psychologist nor sociologist, my own interviews with the ordinary man in the street, which I do as a former Benedictine monk who is trained at listening to both verbal and nonverbal cues, suggest that the President has been very popular, and one of the main reasons for this has to do with our desire for strong leadership, and a hope that we have our version of Singapore’s Lee Kuan Yew who can transform our country into a much more prosperous one, with fast decision making.
And this is why I suspect people can sometimes also be nostalgic about the days of Marcos, and are supportive of the return to power of the Marcoses as they remember these days as the days of a lot of infrastructure built – roads, the CCP complex, to name a few. This need not be mutually exclusive of an appreciation of democracy. Some of us may think that these ideas may have been influenced by propaganda. But whether people’s views are factual or not is beside the point. When I try to understand how people think, I first suspend my judgments on morality and facts, and view opinions as not black or white, but just as being different from mine, often coming from people’s needs.
Interestingly, the analysis of Geoff Ducanes supports my conjecture about the desire of Filipinos for a strongman, which I developed simply by having conversations, since surveys are not the only ways to collect data, and more detailed interviews of key informants can provide opportunities to probe. Ducanes suggests from an attempt to model explanations of the approval ratings that, people who saw Duterte as “decisive,” “diligent” and “authentic,” especially the first two traits, were more likely to be satisfied with him. Besides being authentic, to a number of people, Duterte – viewed as the familiar kanto boy Doming Tigas – is entertaining, and we Filipinos love entertainment.
The model of Ducanes that uses perception of character traits of the President was reported to correctly predict 99% of those who were satisfied and 45% of dissatisfied respondents.
I would suspect that geography also matters, as my conversations suggest that those originally from outside Metro Manila, who are peeved at imperial Manila, are likely to be strong supporters of the President, especially if they are from Mindanao. This was validated also by Ducanes, though the model’s explanatory power was not as strong as the earlier model.
Some of us who have been critical of pandemic management of the administration may find it puzzling that the pandemic does not seem to lead to a much bigger proportion of people who disapprove of the President. So, we may think the surveys must be wrong! And thus we start becoming skeptical of SWS and Pulse Asia.
However, again when I talk with ordinary people on the street, barbers, Grab drivers, included, I sense that many are pleased that government provided ayuda. People I interviewed say something is better than nothing, and further, the pandemic is a global problem, so we should not be blaming Duterte for this. I noticed a lot of empathy for the President, viewed as a fatherly figure, with some semblance of the results of Focus Groups Discussions conducted by Pulse Asia with respondents that revealed a perception of President Duterte as being hardworking for making speeches late at night.
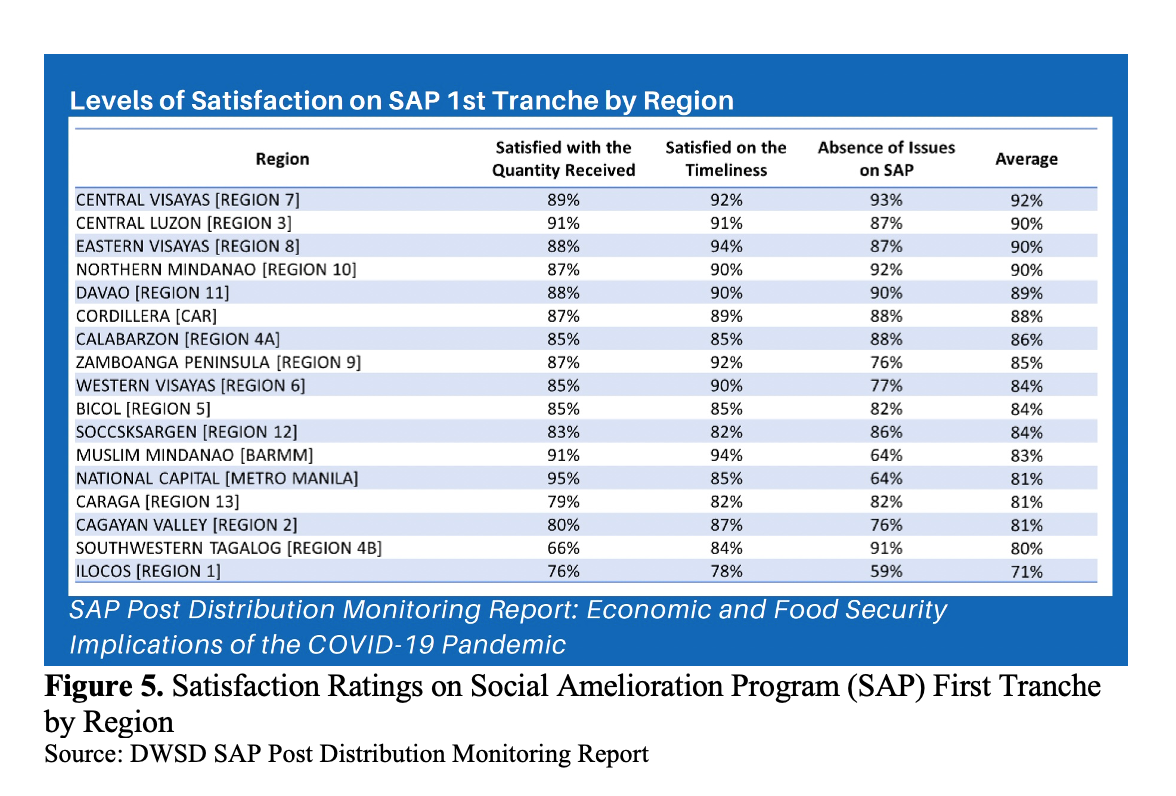
The Social Amelioration Program (SAP), or ayuda, of national government was meant to reach 75% of households, and results of the DWSD SAP Post Distribution Monitoring Report data (Figure 5) suggest a large proportion of beneficiaries being satisfied with the SAP. Regions gave average satisfaction ratings for amounts given, timeliness, and implementation ranging from a low of 71% in Ilocos to a high or 92% in Central Visayas, despite the many stories on social media of implementation deficits. We tend to be, after all, a happy people, easily pleased.
– Rappler.com
Dr. Jose Ramon “Toots” Albert is a professional statistician working as a Senior Research Fellow of the government’s think tank Philippine Institute for Development Studies (PIDS). Toots’ interests span poverty and inequality, social protection, education, gender, climate change, sustainable consumption, and various development issues. He earned a PhD in Statistics from the State University of New York at Stony Brook. He teaches part-time at the De La Salle University and at the Asian Institute of Management.
Add a comment
How does this make you feel?
![[WATCH] In The Public Square with John Nery: Preloaded elections?](https://www.rappler.com/tachyon/2023/04/In-the-Public-Square-LS-SQ.jpg?resize=257%2C257&crop=414px%2C0px%2C1080px%2C1080px)
![[Newspoint] 19 million reasons](https://www.rappler.com/tachyon/2022/12/Newspoint-19-million-reasons-December-31-2022.jpg?resize=257%2C257&crop=181px%2C0px%2C900px%2C900px)

![[OPINION] The long revolution: Voices from the ground](https://www.rappler.com/tachyon/2022/06/Long-revolution-June-30-2022.jpg?resize=257%2C257&crop=239px%2C0px%2C720px%2C720px)
![[OPINION] I was called a ‘terrorist supporter’ while observing the Philippine elections](https://www.rappler.com/tachyon/2022/06/RT-poster-blurred.jpeg?resize=257%2C257&crop_strategy=attention)


![[New School] Tama na kayo](https://www.rappler.com/tachyon/2024/02/new-school-tama-na-kayo-feb-6-2024.jpg?resize=257%2C257&crop=290px%2C0px%2C720px%2C720px)


![[EDITORIAL] Kapag bumabagsak ang ratings, balikan ang basics](https://www.rappler.com/tachyon/2024/04/animated-bongbong-marcos-sara-duterte-popularity-numbers-2024-carousel.jpg?resize=257%2C257&crop_strategy=attention)
![[OPINION] Can Marcos survive a voters’ revolt in 2025?](https://www.rappler.com/tachyon/2024/04/tl-voters-revolt-04042024.jpg?resize=257%2C257&crop=251px%2C0px%2C720px%2C720px)
![[In This Economy] Economic charter change is very unpopular – it’s time lawmakers listened](https://www.rappler.com/tachyon/2024/04/in-this-economy-charterchange.jpg?resize=257%2C257&crop=292px%2C0px%2C720px%2C720px)
![[OPINION] Rodrigo Duterte and his ‘unconditional love’ for China](https://www.rappler.com/tachyon/2024/04/rodrigo-duterte-xi-jinping-august-2019.jpeg?resize=257%2C257&crop=91px%2C0px%2C900px%2C900px)


![[The Slingshot] Lito Patay’s 4 hours and 38 minutes of infamy](https://www.rappler.com/tachyon/2024/07/Lito-Patay-4-hours-infamy-July-19-2024.jpg?resize=257%2C257&crop=233px%2C0px%2C720px%2C720px)


There are no comments yet. Add your comment to start the conversation.